


We just dropped pgwatch v6-beta🎉
This is the biggest step forward yet for our open-source PostgreSQL monitoring tool!

This release adds Prometheus exporters as a native monitoring source, meaning teams already running postgres_exporter, patroni and other endpoints can plug straight into pgwatch without re-architecting.

Every Grafana dashboard has been rebuilt on the new v13 schema with a unified layout, and Prometheus now has dashboard parity with Postgres — including brand-new Lock Details and Server Log Events views.

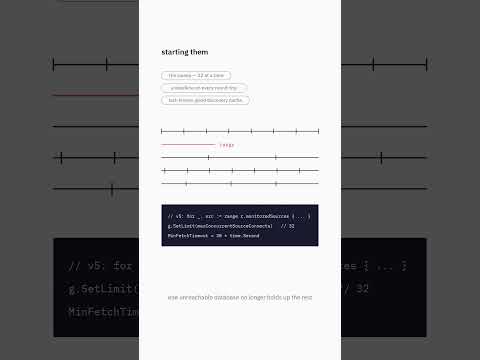
Under the hood, the reaper core (pgwatch's collection engine) now runs its main loop in parallel with bounded database contexts, eliminating a class of hangs and stuck goroutines that showed up under heavy load. Combined with a modernized React 19 WebUI, new lock/recovery/autovacuum metrics, and a security fix removing a hardcoded JWT secret, this is a release built from real operator feedback.
3 weeks ago • PAVLOG
0
0