Upload date
All time
Last hour
Today
This week
This month
This year
Type
All
Video
Channel
Playlist
Movie
Duration
Short (< 4 minutes)
Medium (4-20 minutes)
Long (> 20 minutes)
Sort by
Relevance
Rating
View count
Features
HD
Subtitles/CC
Creative Commons
3D
Live
4K
360°
VR180
HDR
8,123,871 results
WATCH: Map visualization of world "Refugee" migration from 2000-2016....Europe is DOOMED! #caravan #invasion #immigration ...
1,609 views
7y ago
Google Earth has looked the same for 15 years. This is the year that changes — and not just for humans. Gaussian splatting just ...
405,153 views
4mo ago
A* (A Star) pathfinding algorithm visualized on the city streets of Chicago and Rome. Data from OpenStreetMap, OSMnx ...
3,037,616 views
3y ago
Visualizing the population of the world in 2025 using 8 000 physical markers. A lot has changed since my visualization in 2020, ...
274,792 views
1y ago
Your users deserve more than just a spreadsheet or a printed map as the window into your organizations data. That's where ...
769 views
6y ago
12,770 views
The math behind Google Maps. Sponsored by boot.dev - Click this link https://boot.dev/?promo=VERITASIUM and use our code ...
8,837,037 views
Come learn how to build maps, scenes, and layouts in ArcGIS Pro. This session provides an overview of how to author content in ...
79,194 views
9y ago
maps #ngscience @ngcience https://ngscience.com Today we're learning about maps - pictures that show us what different ...
34,982 views
Mastering Mapping: Techniques for Architectural Site Analysis limited-time discount: ...
268,554 views
In this project, we build a geospatial data pipeline to power a real-time visualization built in TouchDesigner. We will look at a ...
18,095 views
My workflow, 8 years in the making. This video is sponsored by Intel https://bit.ly/intelevo Join Newpress, our community-driven ...
1,551,049 views
5y ago
I'm a Motion Designer specialising in long-form explainer videos for news channels, documentary producers, and content creators ...
479,011 views
Making accurate world maps is mathematically impossible. Follow Johnny on Instagram www.instagram.com/johnny.harris/ Help ...
23,775,977 views
Want to find the real answers to all your strategic questions? Want to always figure out a hundred percent of the truth when you ...
4,913 views
10y ago
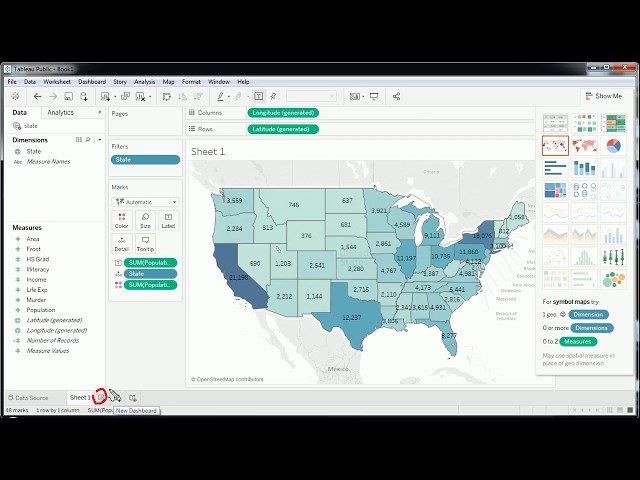
Tableau Map Data Visualizations are real easy. Get started with this quick introductory tutorial.
199,351 views
8y ago
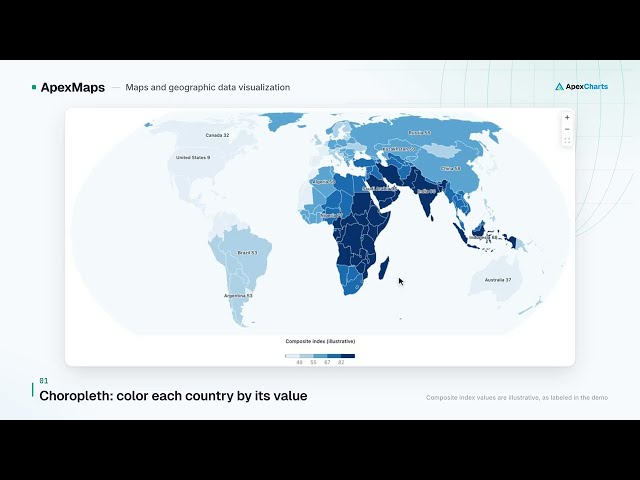
ApexMaps puts your data on a map, with world, US, European and country boundaries built in. This video shows a world ...
53 views
6d ago
Explore the captivating realm of 3D bivariate maps, where temperature and precipitation engage in a mesmerizing dance. In this ...
7,798 views
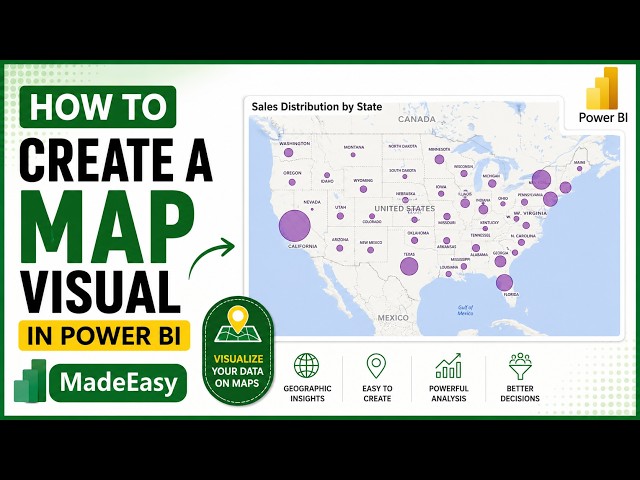
Want to visualize your data on an interactive map in Microsoft Power BI? In this beginner-friendly tutorial, you'll learn how to create ...
1,807 views
3mo ago