Upload date
All time
Last hour
Today
This week
This month
This year
Type
All
Video
Channel
Playlist
Movie
Duration
Short (< 4 minutes)
Medium (4-20 minutes)
Long (> 20 minutes)
Sort by
Relevance
Rating
View count
Features
HD
Subtitles/CC
Creative Commons
3D
Live
4K
360°
VR180
HDR
8,135,482 results
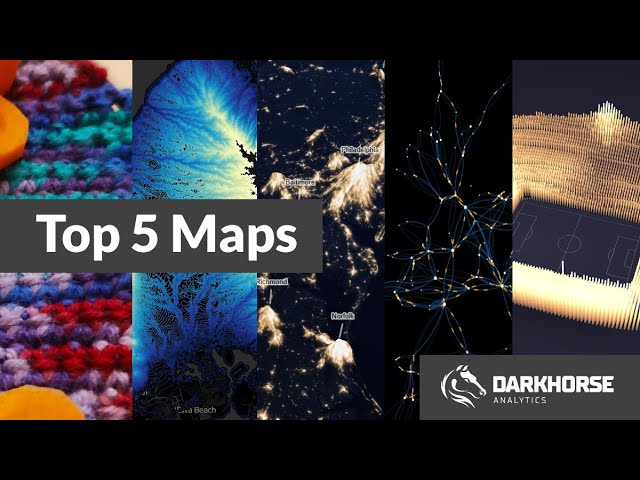
Links to each of the visualizations available at https://dha.io/topviz.
1,538 views
4y ago
A* (A Star) pathfinding algorithm visualized on the city streets of Chicago and Rome. Data from OpenStreetMap, OSMnx ...
3,037,566 views
3y ago
WATCH: Map visualization of world "Refugee" migration from 2000-2016....Europe is DOOMED! #caravan #invasion #immigration ...
1,609 views
7y ago
Power BI Map Visualizations! Delve into the world of Power BI MAP visualization with our insightful tutorial, highlighting five ...
78,362 views
2y ago
Unlock the Secrets of Power BI Maps! In this video, we'll reveal hidden Power BI map hacks 🗺️ that will level up your data ...
52,747 views
Join my Power BI Transformation https://my.datatraining.io/pages/powerbidesigntransformation Let my team develop your reports ...
86,631 views
Step by step video tutorial to create maps in Power BI and exploring the 5 different maps in Power BI standard visualizations.
25,131 views
Learn Excel in just 2 hours: https://kevinstratvert.thinkific.com In this step-by-step tutorial, learn how to take data and transform it ...
365,425 views
5y ago
This 3 minute video is gonna show you how to create an interactive map from a geo-dataframe in Python. It's pretty cool because it ...
37,753 views
Learn how to create a Map visualization in Power View. Display your data in map format and use that data to filter other ...
17,534 views
13y ago
Your users deserve more than just a spreadsheet or a printed map as the window into your organizations data. That's where ...
769 views
6y ago
12,769 views
1y ago