Upload date
All time
Last hour
Today
This week
This month
This year
Type
All
Video
Channel
Playlist
Movie
Duration
Short (< 4 minutes)
Medium (4-20 minutes)
Long (> 20 minutes)
Sort by
Relevance
Rating
View count
Features
HD
Subtitles/CC
Creative Commons
3D
Live
4K
360°
VR180
HDR
8,329,485 results
Data-Driven Documents or D3 is a JavaScript library for drawing SVGs with data. It's the magic behind many of the graphs, charts, ...
605,601 views
5y ago
Get a Free System Design PDF with 158 pages by subscribing to our weekly newsletter: https://bit.ly/bytebytegoytTopic Animation ...
984,620 views
2y ago
Understand-Anything is a new open-source AI tool that turns any codebase into an interactive knowledge graph so developers ...
203,960 views
5mo ago
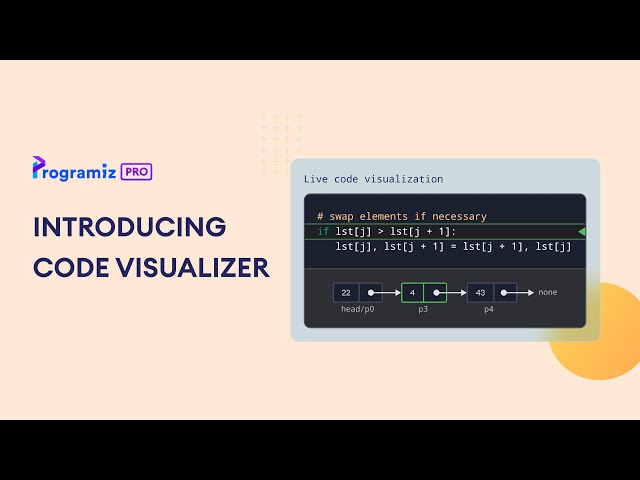
Ever written code that should work... but doesn't? With Code Visualizer, you can watch your code run line by line and see exactly ...
5,152 views
1y ago
Anthropic just released a massive update inside of Claude, introducing Interactive Charts and Diagrams. This new feature allows ...
4,163 views
7mo ago
Mental imagery is a very cool skill - it basically gives you your own personal whiteboard/television to visually play out whatever ...
608,371 views
3y ago
Ryan Fleury's talk at BSC 2025 on the work he's been doing for the Rad Debugger. Ryan's links: - https://rfleury.com ...
83,553 views
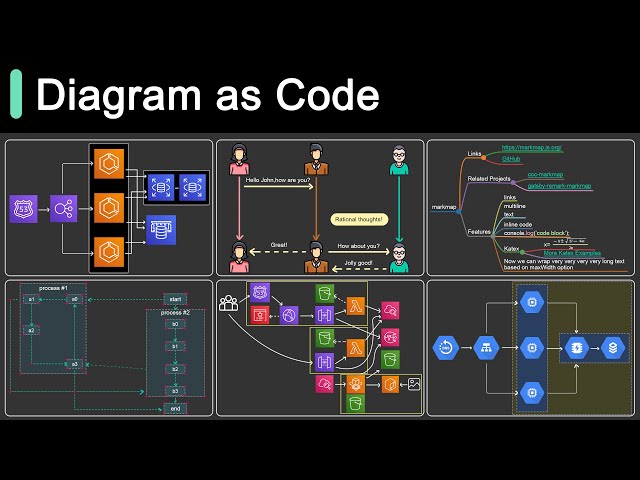
Turn your code into clean, structured diagrams using tools built for developers and designers. Explore options that transform text, ...
1,965 views
10mo ago
Work with me 1:1 (GET UPTO 20% OFF)▻ https://calendly.com/adeelaslam Join the Membership channel for Weekly Live Q&A.
81,555 views
1mo ago
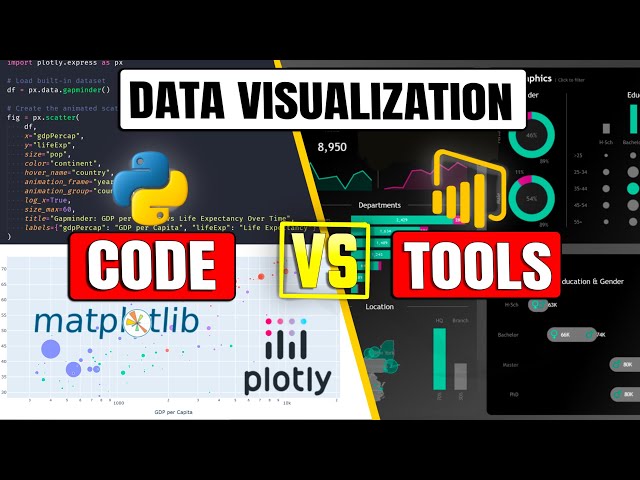
Visually explained breakdown of Python vs Power BI for data visualization, showing when to use code and when to use tools.
22,894 views
Check out my Plarza: https://jonathanblowclips.plarza.com Jonathan Blow demonstrates a tool that maps the type-checked syntax ...
13,079 views
3w ago