Upload date
All time
Last hour
Today
This week
This month
This year
Type
All
Video
Channel
Playlist
Movie
Duration
Short (< 4 minutes)
Medium (4-20 minutes)
Long (> 20 minutes)
Sort by
Relevance
Rating
View count
Features
HD
Subtitles/CC
Creative Commons
3D
Live
4K
360°
VR180
HDR
8,325,429 results
Data-Driven Documents or D3 is a JavaScript library for drawing SVGs with data. It's the magic behind many of the graphs, charts, ...
605,605 views
5y ago
Understand-Anything is a new open-source AI tool that turns any codebase into an interactive knowledge graph so developers ...
203,992 views
5mo ago
Get a Free System Design PDF with 158 pages by subscribing to our weekly newsletter: https://bit.ly/bytebytegoytTopic Animation ...
984,614 views
2y ago
Mental imagery is a very cool skill - it basically gives you your own personal whiteboard/television to visually play out whatever ...
608,326 views
3y ago
Ever written code that should work... but doesn't? With Code Visualizer, you can watch your code run line by line and see exactly ...
5,152 views
1y ago
Anthropic just released a massive update inside of Claude, introducing Interactive Charts and Diagrams. This new feature allows ...
4,161 views
7mo ago
Ryan Fleury's talk at BSC 2025 on the work he's been doing for the Rad Debugger. Ryan's links: - https://rfleury.com ...
83,558 views
Turn your code into clean, structured diagrams using tools built for developers and designers. Explore options that transform text, ...
1,965 views
10mo ago
Visually explained breakdown of Python vs Power BI for data visualization, showing when to use code and when to use tools.
22,895 views
Check out my Plarza: https://jonathanblowclips.plarza.com Jonathan Blow demonstrates a tool that maps the type-checked syntax ...
13,079 views
3w ago
Work with me 1:1 (GET UPTO 20% OFF)▻ https://calendly.com/adeelaslam Join the Membership channel for Weekly Live Q&A.
81,554 views
1mo ago
6 subscribers
In this video Rob, a Kaggle Grandmaster, quickly and humorously walks through each of the popular plotting and data ...
116,586 views
4y ago
This course teaches you how to visualize data in the browser using D3.js. Watch it here or check out the interactive version at ...
343,490 views
8y ago
2 subscribers
In this video, you will learn how to create and configure a project in CODESYS, write simple code, add a basic visualization, and ...
45,441 views
Most AI coding tools can generate diagrams, but they look terrible (wrong spacing, overlapping elements, no visual hierarchy, etc.)
116,408 views
This video is part of an online course, Data Visualization and D3.js. Check out the course here: ...
6,380 views
11y ago
Gemini 2.5 Pro Experimental unlocks state-of-the-art performance in coding, math and science, and multimodal reasoning.
9,912 views
Support me and future courses !!! https://visual-kernel-shop.fourthwall.com https://buymeacoffee.com/visual_kernel Chapters: 0:00 ...
479,130 views
3mo ago
When you first learned to write code, you probably realized that computers don't really have any common sense. You need to tell ...
3,564,991 views
Recorded live on 2016-06-16. Creating a visualization tool about NTSC/composite video signal for a possible future video. Twitter: ...
276,362 views
Streamed 10y ago
Turn dense information into interactive visualizations with the Visualize plugin in ChatGPT and Codex. Katia Gil Guzman shows ...
153,932 views
We are cooking a new surprise for our CODING CHAMPS. 😲 DevTown is being upgraded to SOMETHING NEW, SOMETHING EVEN MORE AWESOME ...
17,893 views
Streamed 4y ago
Gemini 3 pushes the boundaries of multimodal generation. Watch as it codes a complex visual simulation of a Tokamak nuclear ...
20,818 views
11mo ago
The Visualization Level Jose Silva Used to Shift Reality Fast What you're practicing in this video is just the beginning. If you want ...
301,001 views
8mo ago
Visualization of merge sort Improve your coding skills with https://codestandard.net/ Data Structure and Algorithms articles: ...
6,049 views
25 subscribers
Debugging Your Code with Data Visualization [EuroPython 2018 - Talk - 2018-07-26 - Fintry [PyData]] [Edinburgh, UK] By James ...
920 views
Discover how vector embeddings power your favorite apps, from Netflix recommendations to advanced AI models! In this video ...
6,528 views
Gemini 3 uses state-of-the-art reasoning to generate richer visualizations and deeper interactivity. See how it codes a seamless ...
15,651 views
GPU Trace Visualization: What gpuvis Shows You That Your Code Can't In this video, we break down exactly how AI can help you ...
19 views
2w ago
Heavily inspired by Denis Dmitriev's work: https://www.youtube.com/watch?v=3JQ3hYko51Y Music by Roman Senyk Music (The ...
386,793 views
Learn how to use VS Code for beginners with this step-by-step tutorial. Learn how to build a website from a Figma design with ...
372,769 views
C++ #Clang #AccuConf Visualization leverages research on human visual perception. Its application in software engineering ...
1,937 views
7y ago
A visual data story told like a movie. Learn data literacy through animated, hand-drawn sketches created carefully in Procreate on ...
613,382 views
9mo ago
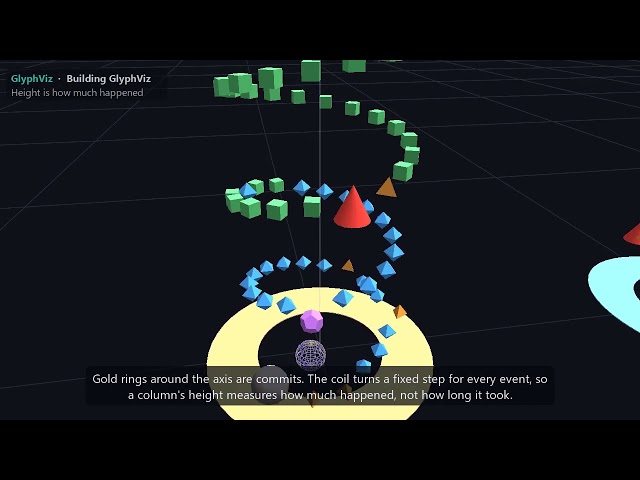
I have wanted to see how much work Claude and I have put in to creating GlyphViz, so I asked Claude to find a way to visualize ...
10 views
There are audio issues with this video that cannot be fixed. We recommend listening to the tutorial without headphones to ...
8,533 views
9y ago
8 views
10y ago
Seaborn #DataVisualization #PythonTutorial #SeabornTutorial #DataScience #PythonDataScience #LearnSeaborn #DataViz ...
123 views
Helix Vizforge - charts, dashboards & data visualization, inside the Unity Editor. In this video: Welcome window, Chart Wizard, live ...
17 views
Here's my multi Claude Code workflow with voice input, showing how to process and visualize data with Python and a bit of ...
27,562 views
Support UPI - https://support.codevolution.dev/ Support Paypal - https://www.paypal.me/Codevolution Github ...
72,751 views
This is just some test.
155 views
17y ago
Celebrating 500k subscribers, I create a map visualization of Coding Train subscriber locations around the world! 24:55 ...
24,243 views
Streamed 8y ago
This Live Stream is the continuation of the Earthquake Data Visualization / Mapping challenge I attempted in episode #77. Links to ...
10,803 views
Streamed 9y ago
Welcome to the Complete Data Visualization in Python Course! In this full video tutorial, we're diving deep into the world of ...
302,069 views
A visualization of how the in-order tree traversal works. If you like this content, please like and subscribe, so I can make more.
56,845 views
This video today is a crash course on Seaborn, a data visualization library for Python built on top of Matplotlib. It makes it super ...
25,304 views
Welcome to another live stream on Rubik's Cube and Quicksort Visualization! I will try to program a simulation of the cube in 3D ...
81,844 views
Streamed 7y ago
Generated using a tool called gource, which can visualize source code changes over time. Check out a visualization of all the ...
15,417 views
12y ago
26 views
404 views
16y ago
There are a handful of commonly used libraries, like matplotlib, seaborn, and plotly that provide amazing functionality. Getting a ...
4,489 views
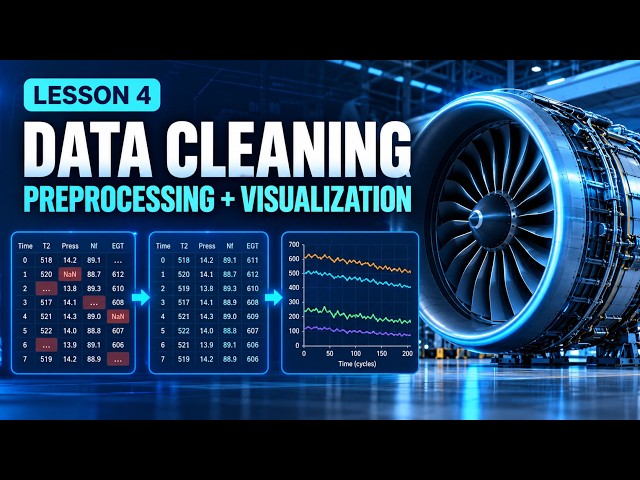
Welcome to Lesson 4 of our Aircraft Engine Failure Prediction project series! In this lesson, we clean and preprocess aircraft ...
39 views