Upload date
All time
Last hour
Today
This week
This month
This year
Type
All
Video
Channel
Playlist
Movie
Duration
Short (< 4 minutes)
Medium (4-20 minutes)
Long (> 20 minutes)
Sort by
Relevance
Rating
View count
Features
HD
Subtitles/CC
Creative Commons
3D
Live
4K
360°
VR180
HDR
1,167 results
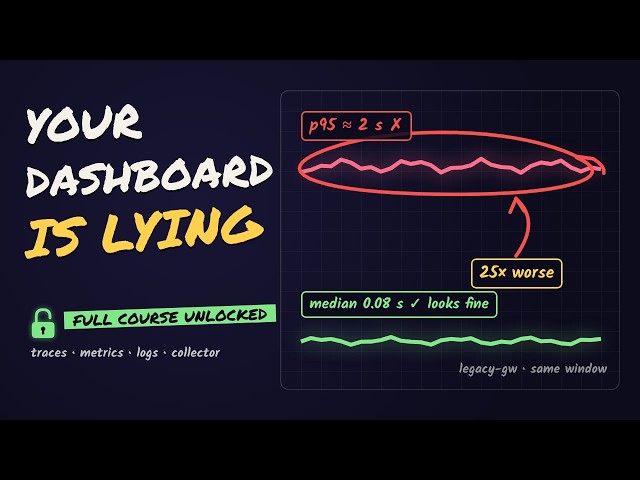
When one checkout request fans out across 50 microservices and fails for 1 in 10000 users, a dashboard of green lights won't ...
1 view
2h ago
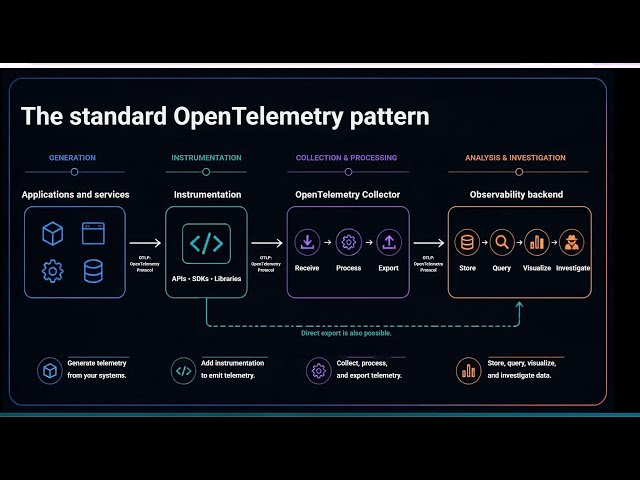
Your application is slow. The application team checks logs. The infrastructure team reviews metrics. The data team investigates ...
143 views
2d ago
If you use OpenTelemetry, you can send your OTLP-compatible logs and traces directly to Sentry without any additional ...
258 views
Streamed 2d ago
Free lab (one git tag per chapter): https://github.com/karthikeyan-lgk/otel-full-course It's Friday, 9 p.m., checkout is slow, and every ...
53 views
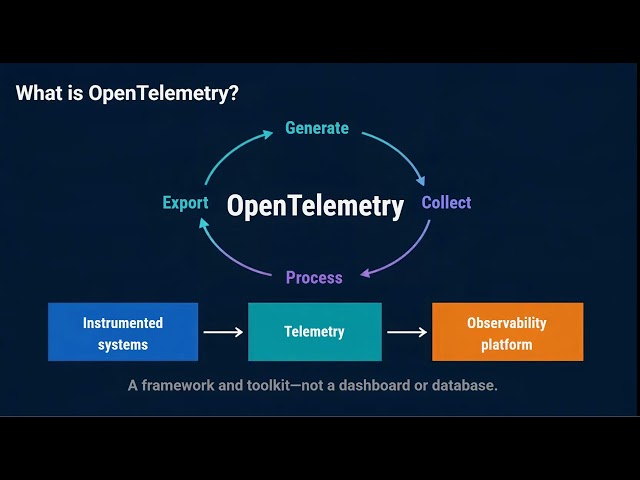
OpenTelemetry. Collectors. Snowflake Event Tables. Snowflake Trail. Observe. AI SRE. These belong in the same observability ...
83 views
3d ago
In this episode of the Grafana OTel Community Call, we're joined by Bejal Lewis and Paschalis Tsilias from Grafana Labs to talk ...
585 views
Streamed 1d ago
Checkout is slow for some users, every dashboard is green, and four teams each swear their service is fast. Nobody can see the ...
45 views
9h ago
Your dashboard says checkout is slow. But where is the time going? Follow one request through metrics, traces and logs. We read ...
87 views
4d ago
jaeger by jaegertracing: https://github.com/jaegertracing/jaeger Jaeger v2 gives teams a focused way to understand distributed ...
129 views
6d ago
How to track new OpenTelemetry Collector software releases from OpenTelemetry Collector. Monitor the public page for future ...
0 views
Get answers to all your OpenTelemetry (OTel) questions in this recorded hands-on workshop from New Relic University.
88 views
1d ago
Turn SQL queries into metrics for your Oracle databases. This introduction covers the free, open-source Oracle AI Database ...
8 views
Your agent paid for an API. The tool call says ok. Did the payment settle? hashspan is an open-source OpenTelemetry library for ...
2 views
Monitoring tells you something is wrong; observability helps you understand why. Olseatech Solutions explains OpenTelemetry ...
28 views
5d ago
Learn how to use **OpenTelemetry in Orchard Core** to improve application observability, monitor performance, and troubleshoot ...
25 views