Upload date
All time
Last hour
Today
This week
This month
This year
Type
All
Video
Channel
Playlist
Movie
Duration
Short (< 4 minutes)
Medium (4-20 minutes)
Long (> 20 minutes)
Sort by
Relevance
Rating
View count
Features
HD
Subtitles/CC
Creative Commons
3D
Live
4K
360°
VR180
HDR
10,307 results
How to Create a Waterfall Chart in Excel (in Excel 2016 or newer) | How to Learn Excel In this video, we'll walk through creating a ...
1,846 views
2y ago
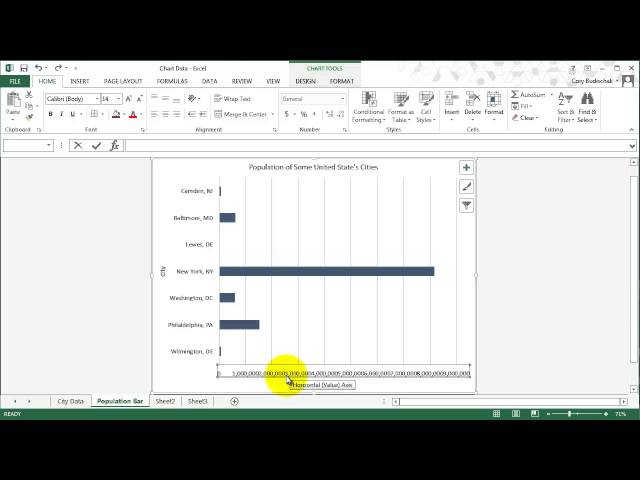
So that's our basic chart - so let's work on prettifying it a bit. The first thing I want to do I'll put some titles on the axes. If I click on this ...
692 views
6y ago
Master Excel in just 12 minutes! Whether you're new to spreadsheets or need a refresher, this step-by-step tutorial will teach you ...
242 views
1y ago
This video covers how to create column, bar, and pie charts and how to label axis and put a title on the chart. This video is part of ...
5,923 views
12y ago
In this video of #engineeringmanagementacademy #sparklines are tutored for #communication_management by ...
221 views
Excel Charts 101: Best Practices for Clean and Effective Charts In this tutorial, you will learn: How to properly organize your data ...
326 views
In this video of #engineeringmanagementacademy #pivottable is tutored in an #ExcelProject by #DrMehrdadArashpour ❎ Excel ...
467 views
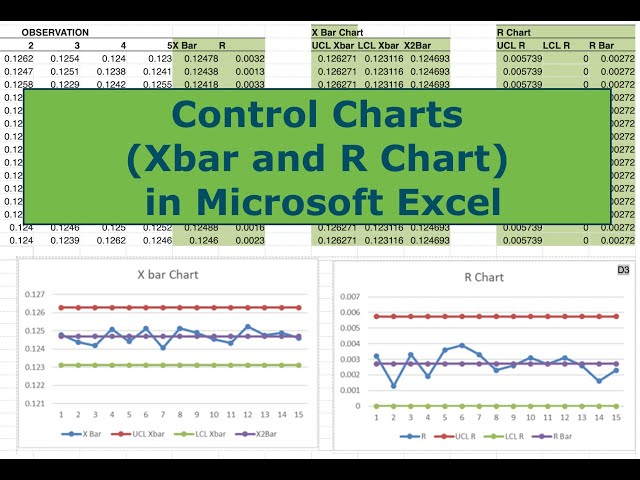
In this video I walk you through all the steps necessary to construct Control Charts (Xbar and R) in Microsoft Excel. Control charts ...
48,692 views
7y ago
Learn more about Inserting Charts in Microsoft Excel | insert chart in excel | Create Chart in Excel | 2D - 3D Chart its easy process ...
22 views
5y ago
Basics of graphing in Microsoft Excel. This video is licensed under CC-BY-SA.
303 views
Do you want to know how to make a graph with Microsoft Access? First, create a query with the data for the chart. Then make a ...
126,435 views
In this lesson, I will be teaching you how to calculate student grades using Microsoft Excel. #Excel #Microsoft #AdjoTech ...
249,533 views
In this video drawing 3D #ganttchart in #excel is explained by #drmehrdadarashpour → #ganttdiagram #ganttchartexcel ❎ Excel ...
2,487 views
In this video I show you how to create a pivot chart and a Pareto chart using Excel.
1,115 views
This video covers stacked and 100% stacked area charts. This video is part of an excel class in the Energy Management and ...
2,137 views
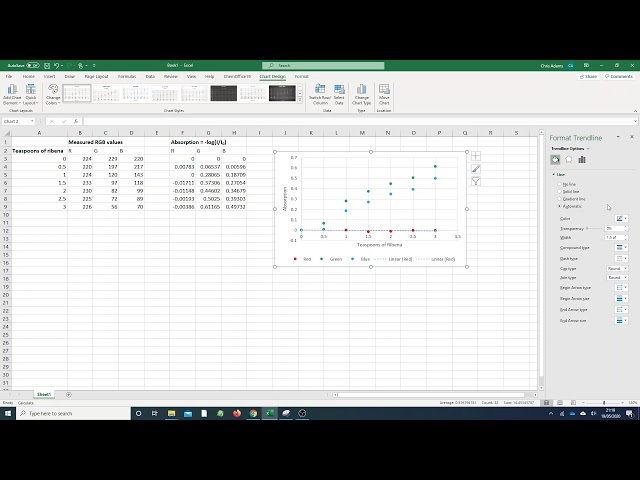
In this video, we will look at three different types of graphs in Excel - bar, line and scatter graphs. We will look at calculating the ...
101 views
Welcome to the my Channel : newtech4niit kumar My Previour Class Links Frist Excel Class Link: https://youtu.be/8Sqb2n7e3VQ ...
21 views
Demonstrates how to use the =COUNTIF function to create a frequency table for categorical data which can then be used to create ...
134 views
This video covers basics of working with big data in excel including: Split Panes, GoTo, shift vs. control for selecting cells, and ...
3,143 views
Use a pivot table to easily generate a frequency table with raw categorical data. This can then be used to create a bar graph or pie ...
93 views
8mo ago