ViewTube

ViewTube
Sign inSign upSubscriptions
Filters

Upload date

Type

Duration

Sort by

Features

Reset

119 results

Matleena Laakso
How to Analyse Excel Data and Create Charts with AI

This video offers practical tips for using AI. The videos in this playlist were created for the SALTO Digital Resource Centre. SALTO ...

6:27
How to Analyse Excel Data and Create Charts with AI

25 views

3w ago

Analytics Advisors
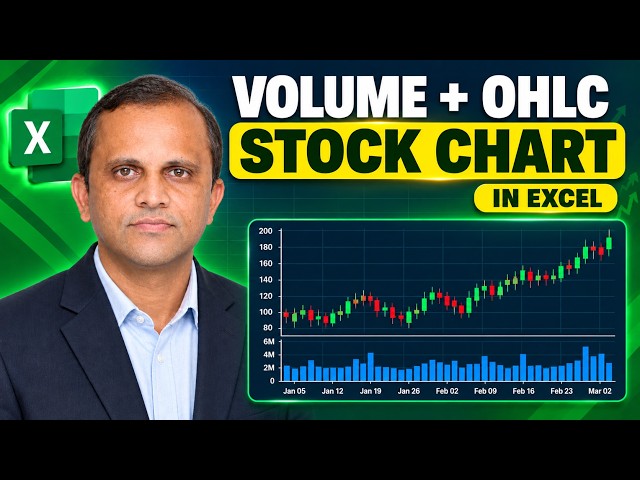
115. Excel Stock Chart Tutorial: Volume, Open, High, Low and Close

My Microsoft Excel Playlist: https://www.youtube.com/playlist?list=PLHrw3fxxgFBRyH308kfvRZnAIevkaKkf0 Join Whatsapp group: ...

2:49
115. Excel Stock Chart Tutorial: Volume, Open, High, Low and Close

12,516 views

6d ago

TOMTECH
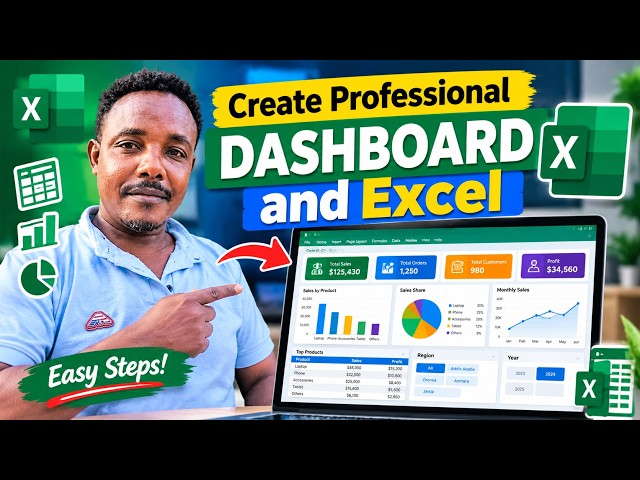
How to Create a Professional Dashboard in Excel | Step-by-Step Tutorial*

how to create a **professional and interactive Excel Dashboard** step by step using charts, tables, slicers, and Excel tools.

19:17
How to Create a Professional Dashboard in Excel | Step-by-Step Tutorial*

206 views

3w ago

Analytics Advisors
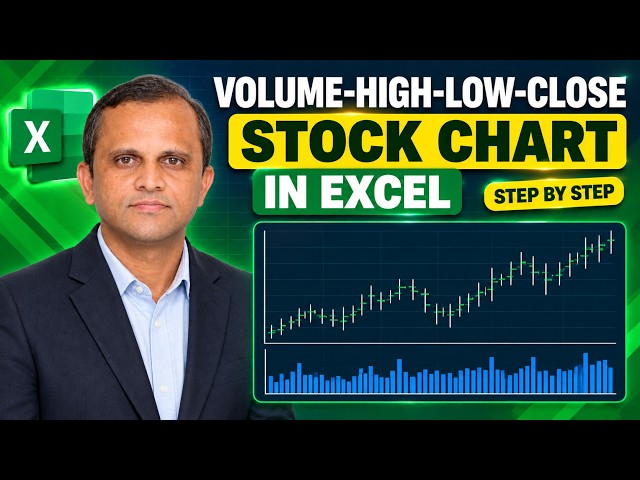
114. Excel Stock Chart Tutorial: Volume, High, Low & Close

My Microsoft Excel Playlist: https://www.youtube.com/playlist?list=PLHrw3fxxgFBRyH308kfvRZnAIevkaKkf0 Join Whatsapp group: ...

2:22
114. Excel Stock Chart Tutorial: Volume, High, Low & Close

5,432 views

8d ago

Analytics Advisors
110. Excel Surface Charts: Create a Wireframe Contour Chart

My Microsoft Excel Playlist: https://www.youtube.com/playlist?list=PLHrw3fxxgFBRyH308kfvRZnAIevkaKkf0 Join Whatsapp group: ...

2:06
110. Excel Surface Charts: Create a Wireframe Contour Chart

5,895 views

2w ago

Analytics Advisors
106. Excel Surface Charts: Types, Uses, Advantages & Disadvantages

If this lesson is useful, please like the video, share it with others, and subscribe for more Microsoft Excel chart tutorials.

2:46
106. Excel Surface Charts: Types, Uses, Advantages & Disadvantages

8,334 views

3w ago

Jeff Risher
BUS 5253 Excel Tutorial   Correlation and Regression

In this video you'll learn how to run simple linear regression in Excel This data set shows the inventory of diamonds and the price ...

35:43
BUS 5253 Excel Tutorial Correlation and Regression

2 views

6d ago

Analytics Advisors
113. Excel Stock Charts Explained: Create an Open-High-Low-Close (OHLC) Chart

My Microsoft Excel Playlist: https://www.youtube.com/playlist?list=PLHrw3fxxgFBRyH308kfvRZnAIevkaKkf0 Join Whatsapp group: ...

3:01
113. Excel Stock Charts Explained: Create an Open-High-Low-Close (OHLC) Chart

7,359 views

10d ago

Christine Coreno
Pie Chart in Sheets for Vitamin C example

If we want to make pie charts, I'm going to get rid of the totals. So, leave adding the totals is going to confuse the pie chart. So, we ...

2:23
Pie Chart in Sheets for Vitamin C example

120 views

13d ago

Engineering Surface
Gantt Pro Excel: Complete Project Management Dashboard and Gantt Chart

Discover Gantt Pro Excel, an Excel-native project-planning and control tool with a live Gantt timeline, visual task dependencies, ...

11:37
Gantt Pro Excel: Complete Project Management Dashboard and Gantt Chart

52 views

3w ago

Analytics Advisors
112. Excel Stock Chart for Beginners | High-Low-Close Explained

My Microsoft Excel Playlist: https://www.youtube.com/playlist?list=PLHrw3fxxgFBRyH308kfvRZnAIevkaKkf0 Join Whatsapp group: ...

3:27
112. Excel Stock Chart for Beginners | High-Low-Close Explained

5,306 views

13d ago

Analytics Advisors
105. How to Create a Professional Filled Radar Chart

My Microsoft Excel Playlist: https://www.youtube.com/playlist?list=PLHrw3fxxgFBRyH308kfvRZnAIevkaKkf0 Join Whatsapp group: ...

2:12
105. How to Create a Professional Filled Radar Chart

12,407 views

4w ago

Analytics Advisors
111. Stock Charts in Excel Explained | Types, Uses, Pros & Cons

If this lesson is useful, please like the video, share it with others, and subscribe for more Microsoft Excel chart tutorials.

2:53
111. Stock Charts in Excel Explained | Types, Uses, Pros & Cons

14,677 views

2w ago

Discover Your Mad Skills Masterclass
Excel Demo: Building a Revenue to Operating Profit Waterfall Chart

Most teams show five separate numbers and hope the judges connect the dots. Top teams make the economics visible.

4:03
Excel Demo: Building a Revenue to Operating Profit Waterfall Chart

5 views

2w ago

Analytics Advisors
109. Excel Surface Charts: How to create a Contour Chart

My Microsoft Excel Playlist: https://www.youtube.com/playlist?list=PLHrw3fxxgFBRyH308kfvRZnAIevkaKkf0 Join Whatsapp group: ...

2:28
109. Excel Surface Charts: How to create a Contour Chart

12,494 views

2w ago

Analytics Advisors
104. How to Create a Radar Chart with Markers in Excel | Step-by-Step Tutorial

My Microsoft Excel Playlist: https://www.youtube.com/playlist?list=PLHrw3fxxgFBRyH308kfvRZnAIevkaKkf0 Join Whatsapp group: ...

1:44
104. How to Create a Radar Chart with Markers in Excel | Step-by-Step Tutorial

8,429 views

1mo ago

The Tech Life
How to Make a Project Plan Template Calculator in Excel

Learn how to make a simple Project Plan Template Calculator in Excel to track tasks, schedules, project costs, progress, and ...

11:51
How to Make a Project Plan Template Calculator in Excel

12 views

2w ago

Rohit patle
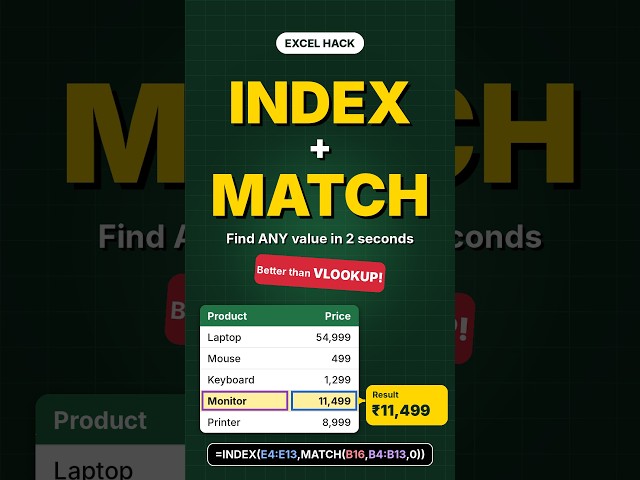
Excel INDEX MATCH #excel #exceltutorial #trending
0:34
Excel INDEX MATCH #excel #exceltutorial #trending

357 views

2d ago

Analytics Advisors
107. Excel Surface Charts: How to create a 3-D Surface Chart

My Microsoft Excel Playlist: https://www.youtube.com/playlist?list=PLHrw3fxxgFBRyH308kfvRZnAIevkaKkf0 Join Whatsapp group: ...

3:09
107. Excel Surface Charts: How to create a 3-D Surface Chart

7,459 views

3w ago

Analytics Advisors
108. Excel Surface Charts: How to create a 3-D Wireframe Surface Chart

My Microsoft Excel Playlist: https://www.youtube.com/playlist?list=PLHrw3fxxgFBRyH308kfvRZnAIevkaKkf0 Join Whatsapp group: ...

2:04
108. Excel Surface Charts: How to create a 3-D Wireframe Surface Chart

11,574 views

3w ago