Upload date
All time
Last hour
Today
This week
This month
This year
Type
All
Video
Channel
Playlist
Movie
Duration
Short (< 4 minutes)
Medium (4-20 minutes)
Long (> 20 minutes)
Sort by
Relevance
Rating
View count
Features
HD
Subtitles/CC
Creative Commons
3D
Live
4K
360°
VR180
HDR
5,888,809 results
Links to each of the visualizations available at https://dha.io/topviz.
1,538 views
4y ago
Atlist — https://www.atlist.com/?c=a_video_my_maps_tutorial Google My Maps — https://www.google.com/mymaps Google My ...
326,971 views
2y ago
Making accurate world maps is mathematically impossible. Follow Johnny on Instagram www.instagram.com/johnny.harris/ Help ...
23,775,158 views
9y ago
Unlock the Secrets of Power BI Maps! In this video, we'll reveal hidden Power BI map hacks 🗺️ that will level up your data ...
52,742 views
This video tutorial has been taken from Mastering Data Visualization with D3.js. You can learn more and buy the full video course ...
2,760 views
7y ago
Learn Excel in just 2 hours: https://kevinstratvert.thinkific.com In this step-by-step tutorial, learn how to take data and transform it ...
365,394 views
5y ago
Poland from 20000 BC to 10000 From the frozen Ice Age to modern Poland — and an imaginary scorching desert future.
17,131 views
2d ago
Learn how to create a Map visualization in Power View. Display your data in map format and use that data to filter other ...
17,534 views
13y ago
Where in the world is Steam completely banned, restricted, or fully accessible in 2026? In this episode of Geo Map ...
8,009 views
1d ago
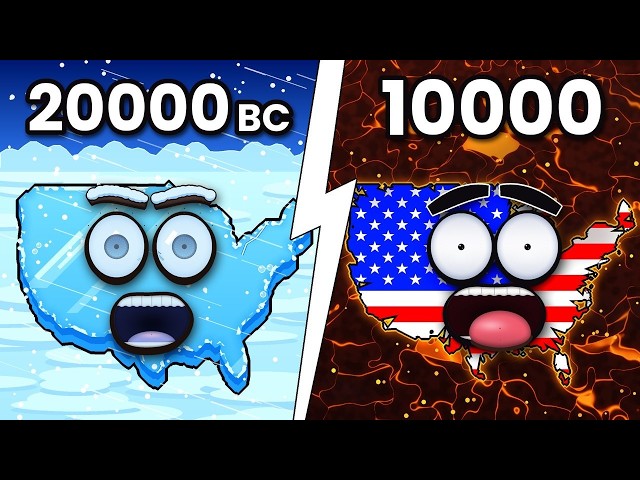
USA from 20000 BC to 10000 From the frozen Ice Age to modern America — and an imaginary future of lava and fire.
1,956 views
1h ago
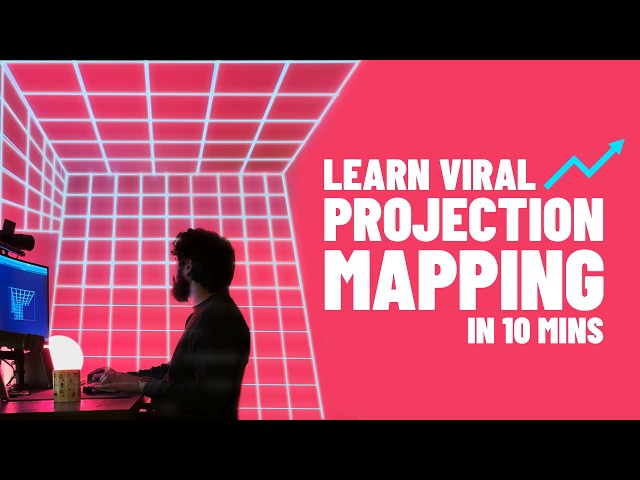
EASY projection mapping tutorial for beginners / Motion by Nick / Nick Greenawalt Projection Mapping Software: (Mobile) Lazy ...
462,137 views
9mo ago
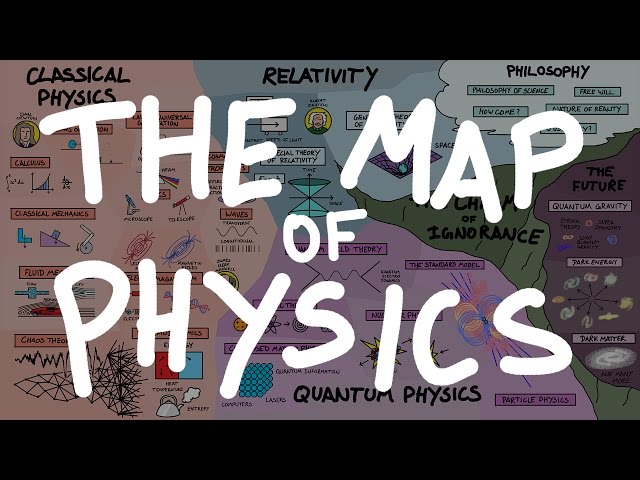
Everything we know about physics - and a few things we don't - in a simple map. Get the maps! https://www.dosmaps.com Here's ...
6,714,364 views
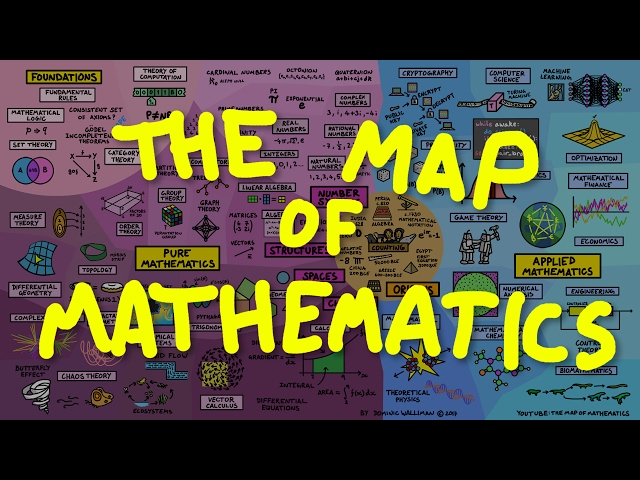
The entire field of mathematics summarised in a single map! This shows how pure mathematics and applied mathematics relate to ...
16,237,154 views
Master World Map Visualization in Excel Discover how to craft an engaging world map chart in Excel with region-specific data ...
5,767 views
3y ago
The first 1000 people to use this link will get a 1 month free trial of Skillshare: https://skl.sh/boonelovesvideo10211 GEOlayers ...
98,636 views
Learn how to create your own map chart in Excel! Map charts are a great tool for visualizing data by geography. ***Support ...
447,111 views
Geographic Maps Lecture, 2021. Arrange Spatial Data (Ch 8) I, Visualization Analysis & Design by Tamara Munzner, ...
6,800 views
Geospatial mapping turns geographic data into visual insights that support real-world decisions. In this video, we explain how GIS, ...
1,907 views
8mo ago
Since we are covering numerous controversial topics in this video, I wanted to be sure and include lots of links for you to do your ...
2,462,320 views
High-quality assets to enhance your architectural drawings. Check out our packs: https://packs.learnupstairs.com/ Take your ...
423,174 views