Upload date
All time
Last hour
Today
This week
This month
This year
Type
All
Video
Channel
Playlist
Movie
Duration
Short (< 4 minutes)
Medium (4-20 minutes)
Long (> 20 minutes)
Sort by
Relevance
Rating
View count
Features
HD
Subtitles/CC
Creative Commons
3D
Live
4K
360°
VR180
HDR
99 results
Welcome to Code Practice! and Welcome to my Power BI beginner series! In this video, we'll understand what Power BI is, why it ...
5 views
21h ago
I wrote my own wormhole renderer to visualize wormholes in 3D environments (forest + mars) and explained how it works.
93,962 views
18h ago
Watch the development journey of PCL by Meloong-Git! Minecraft 启动器 Plain Craft Launcher(PCL)。 ⭐ 8887 stars ...
17 views
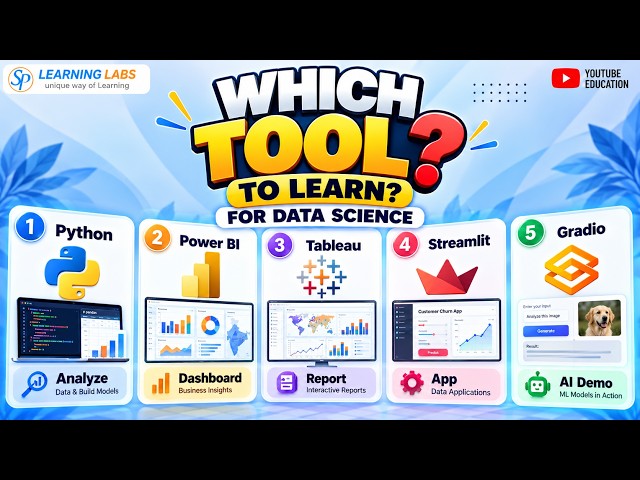
Which Data Visualization tool should you learn for Data Science? Python, Power BI, Tableau, Streamlit, Gradio — each tool solves ...
7 views
17h ago
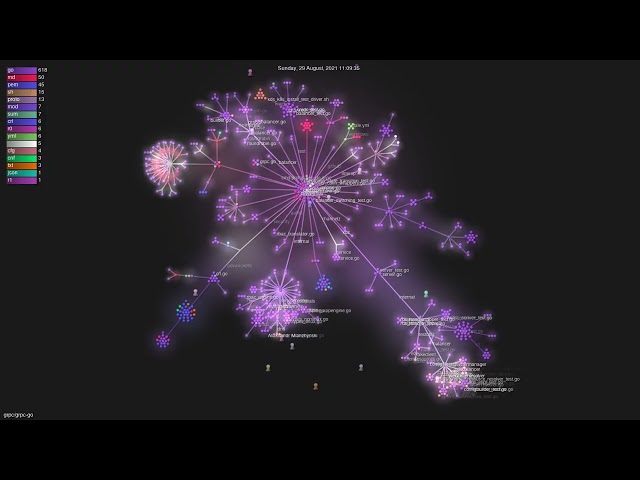
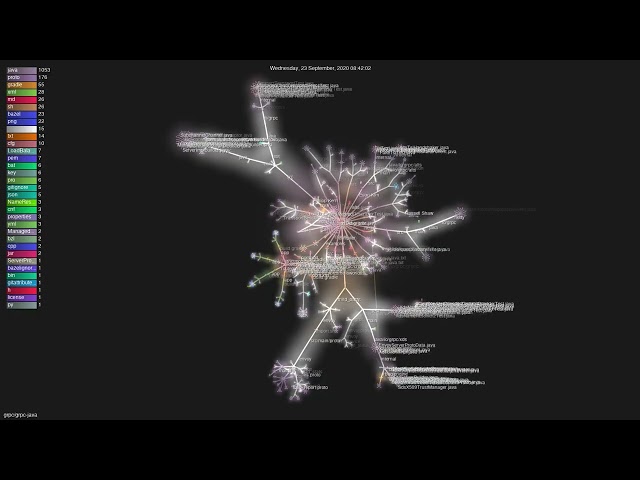
Watch the development journey of grpc-go by grpc! The Go language implementation of gRPC. HTTP/2 based RPC ⭐ 23099 ...
19 views
7h ago
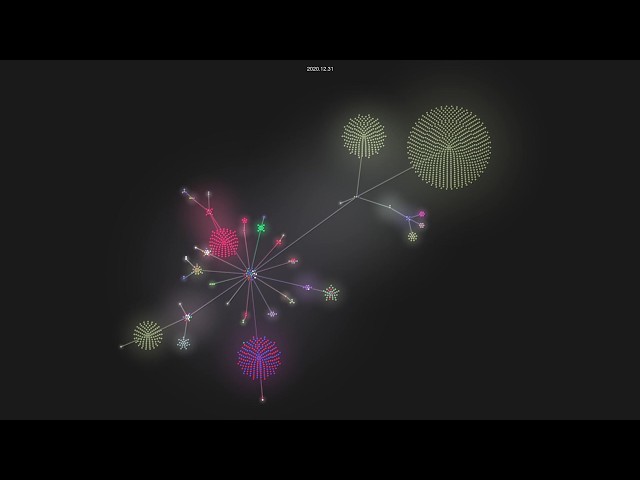
git history visualization of https://github.com/fish-shell/fish-shell 15 years, 3 months of development, 704 contributors watch on ...
0 views
14h ago
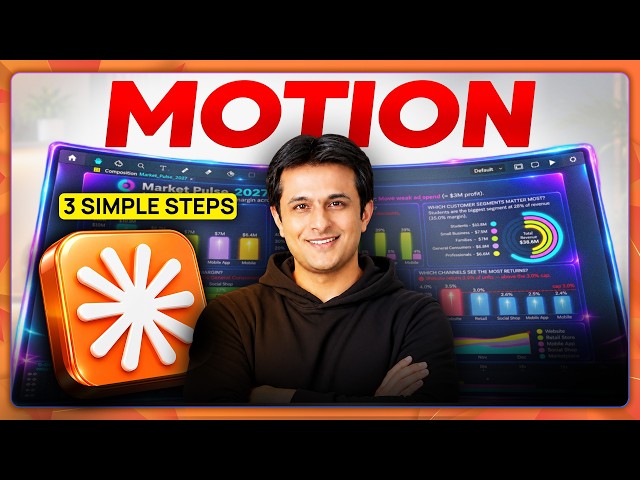
Tired of boring Excel reports? Turn messy Excel files into a 30+ visual interactive dashboard + 30-sec animated video in 15 ...
5,610 views
Watch the development journey of grpc-java by grpc! The Java gRPC implementation. HTTP/2 based RPC ⭐ 12073 stars ...
18 views
12h ago
How do you move from a computational model to hundreds of printable, testable and buildable architectural components?
43 views
19h ago
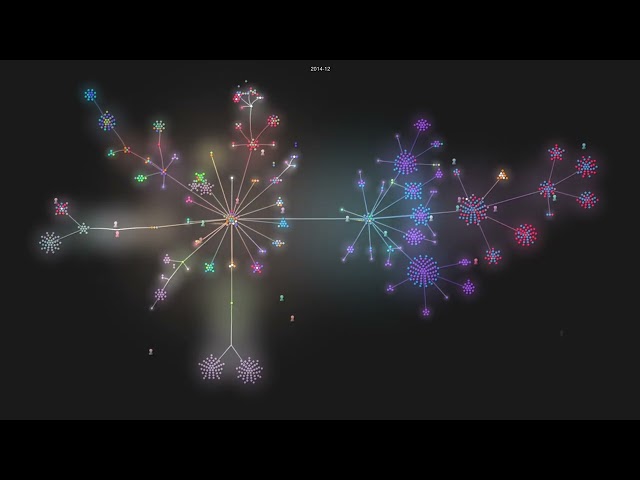
Evolution of protobuf code base visualized in Gource.
3 views
13h ago
Welcome to the official introduction and tutorial for StatLab — a fast, powerful, and beginner-friendly data analysis tool I built using ...
51 views
1d ago
Gas Turbine Design & Performance Analysis — 15 MW Power Generation Research Project - program for download ## Design, ...
8 views
Welcome to Episode 3 of AI in GIS and Remote Sensing for Beginners! 🛰️ In this video, you'll go from zero to loading a real ...
Tired of coding charts in R or Python? Here are 14 publication-ready charts in DataStatPro, made step by step with real data.
11 views
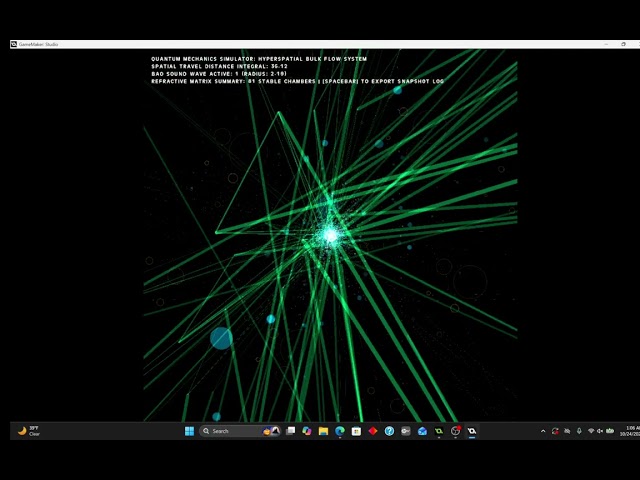
Technical Brief: How the Equations Work Together When you load up the simulator on your screen, you can use these four core ...
6 views
1h ago
Every experiment is built from scratch in code and run exactly as shown. Subscribe so you don't miss the next one. A made-up ...
2 views
You hid the column. You hid the table. You filtered the page. Your Power BI report looks private, but Microsoft's own ...
15h ago
446 views
10h ago
In this video, we break down the VeriSign's financial performance using an intuitive heatmap visualization, making it easier to ...
9 views
4h ago
In this video, we break down the IBM's financial performance using an intuitive heatmap visualization, making it easier to ...
5h ago