Upload date
All time
Last hour
Today
This week
This month
This year
Type
All
Video
Channel
Playlist
Movie
Duration
Short (< 4 minutes)
Medium (4-20 minutes)
Long (> 20 minutes)
Sort by
Relevance
Rating
View count
Features
HD
Subtitles/CC
Creative Commons
3D
Live
4K
360°
VR180
HDR
2,794,817 results
Curious about a career in Data Analytics? Book a call with a program advisor: https://bit.ly/47LEBk3 What exactly is data analytics ...
2,329,612 views
5y ago
If you want to become a standout data analyst through applied business skills, soft skills, and strategies for every part of the job ...
82,100 views
1y ago
... Datacamp Power BI Fundamentals Track: https://powerbi-fundamentals.kevinstratvert.com - Datacamp Data Analyst in Power ...
2,165,164 views
... Industry Recognized Certifications Data Analyst Certification Program - https://datacamp.pxf.io/YRkWZq PowerBI Data Analyst ...
10,665 views
7mo ago
... answer data analytics important questions such as what data analyst skills (SQL, Microsoft Excel, Tableau, Data Visualization, ...
1,317,063 views
2y ago
You've probably heard the term data visualization thrown around a lot. It's why you're here, isn't it? So let's make it clear — data ...
200,045 views
4y ago
View full lesson: http://ed.ted.com/lessons/david-mccandless-the-beauty-of-data-visualization David McCandless turns complex ...
1,610,597 views
13y ago
Micrososft Azure - Data Analyst Course ...
55,736 views
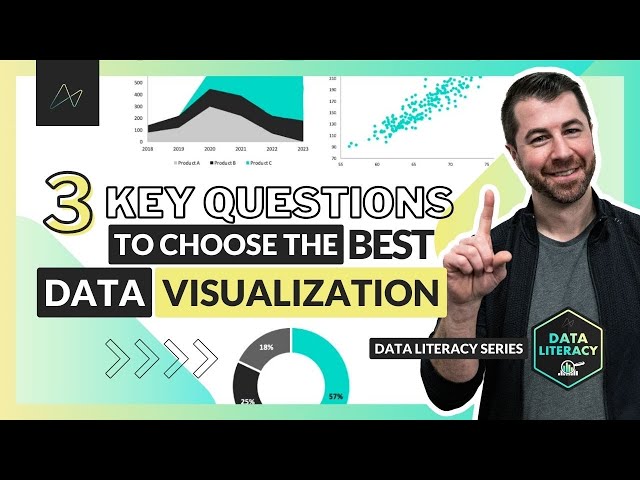
In this video, Chris Dutton breaks down the 3 key questions you should ask yourself when choosing the best chart for your data ...
10,815 views
Let's look at how we can implement design concepts and techniques to maximize the impact of our dashboards and reports.
97,534 views
302,504 views
9mo ago
Setup, conflict, resolution. You know right away when you see an effective chart or graphic. It hits you with an immediate sense of ...
700,181 views
6y ago
Sign up for Our Complete Data Science Training with 57% OFF: https://bit.ly/3PXCt29 Considering a career in data analytics?
12,109 views
Welcome to Part one of a multi part series on Data Visualization. This video will provide an introductory overview of data ...
6,969 views
If you're interested in data science and quantitative analysis, then this video is for you. If you are a beginner and want to learn ...
131,744 views
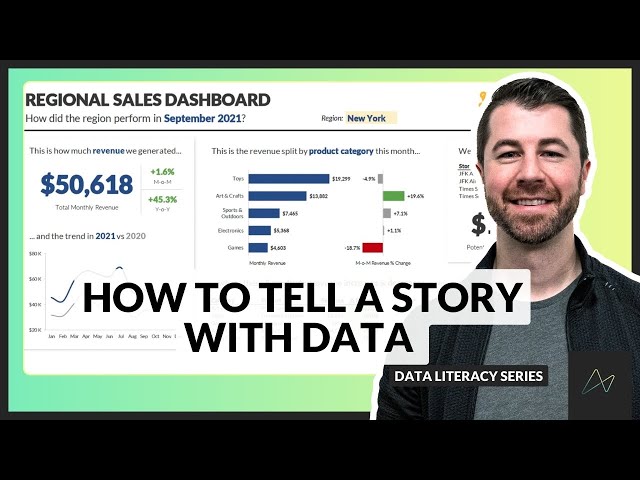
In this video, Chris Dutton explains the framework for telling clear and effective stories with data, an important topic for anyone ...
418,264 views
Go from zero to a data analyst in 8-16 months. This step-by-step roadmap covers the essential skills you must learn to become a ...
842,980 views
AD: Sign up to enroll for a 7-day free trial with Coursera now!
3,444,884 views
3y ago
LEARN BUSINESS INTELLIGENCE ============================= BI Analyst Starter Program – https://geni.us/lbia_biasp ...
398,541 views
In this video, we will demonstrate the difference between data visualization charts including: - Bar Chart - Line Chart - Bubble ...
204,404 views