Upload date
All time
Last hour
Today
This week
This month
This year
Type
All
Video
Channel
Playlist
Movie
Duration
Short (< 4 minutes)
Medium (4-20 minutes)
Long (> 20 minutes)
Sort by
Relevance
Rating
View count
Features
HD
Subtitles/CC
Creative Commons
3D
Live
4K
360°
VR180
HDR
435,383 results
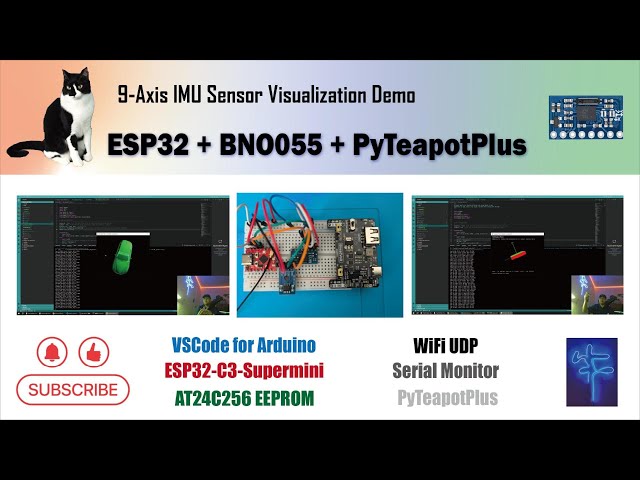
Wondering how the absolute orientation of BNO055 works? This video will show my solutions to visualize this famous sensor via ...
290 views
9mo ago
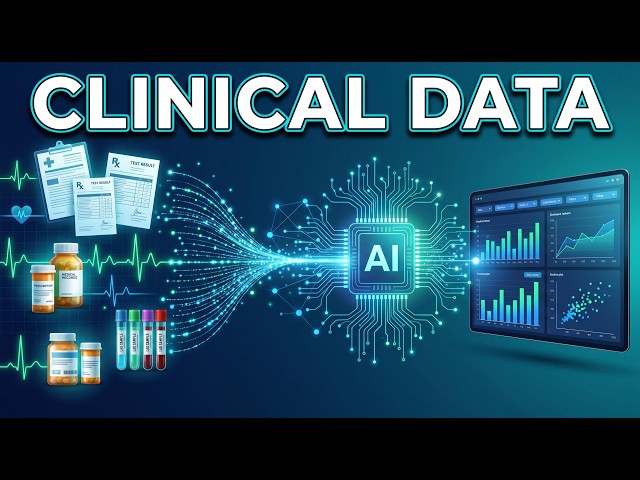
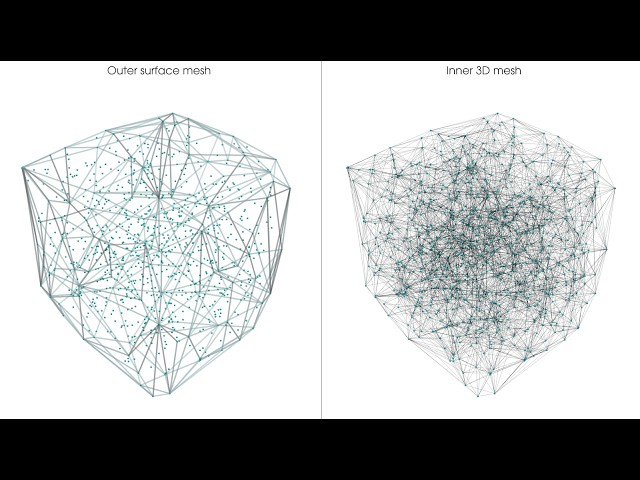
Clinical and Biological information are now more abundant than ever. This means that we will need help to understand, ...
4 views
2mo ago
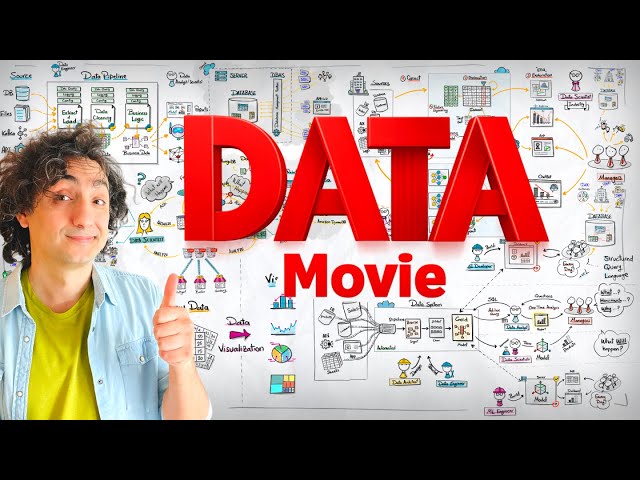
A visual data story told like a movie. Learn data literacy through animated, hand-drawn sketches created carefully in Procreate on ...
613,521 views
This video today is a crash course on Seaborn, a data visualization library for Python built on top of Matplotlib. It makes it super ...
25,332 views
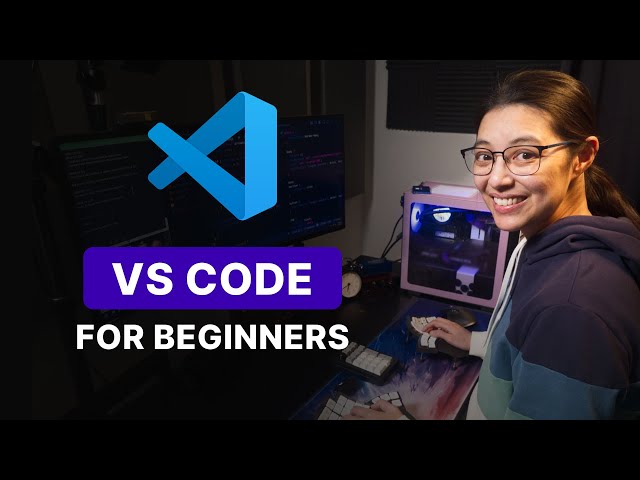
Learn how to use VS Code for beginners with this step-by-step tutorial. Learn how to build a website from a Figma design with ...
373,126 views
10mo ago
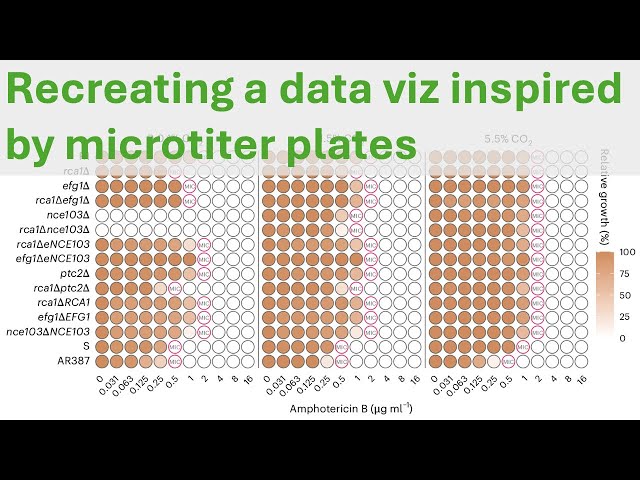
After critiquing this figure and recreating it, now it's time to see if we can't improve it in R.
441 views
Streamed 11mo ago
To learn for free on Brilliant, go to https://brilliant.org/techwithtim . Brilliant's also given our viewers 20% off an annual Premium ...
69,753 views
8mo ago
Alexis and Stefano share interesting dialogs from the SolveIt community, and from working with SolveIt. EPISODE 3 (2025-12-18): ...
95 views
Build an intuitive mental model of core data structures and algorithms using relatable, real-world analogies. Topics range from ...
304,683 views
Omni built the best agentic harness for analytics tailored for and powered by Claude models, with 99% of the platform's code ...
48,706 views
5mo ago
On March 19th, 2026, we officially launched Dashtera®, our new no-code data analytics and dashboarding platform. After several ...
142 views
6mo ago
25 views
The classic raining code screensaver from The Matrix, now remastered in 4K ultra high definition (UHD) at a buttery-smooth 60 fps ...
31,378 views
Building complex, customized dataPARC graphics has traditionally required specialized engineering skills or long development ...
509 views
11mo ago
Introduces ggplot2, choosing the right graph (boxplot, histogram, scatterplot, bar chart), and basic customization essentials.
20 views
While AI assistants excel at generating standard UI components, complex graph visualizations demand strict architectural ...
695 views
3mo ago
14 views
Pat creates two plots in this livestream. First, he recreates a horizontal of panels that were presented as facets in the original figure ...
563 views
Streamed 9mo ago
Other SFU Research Computing training events: https://training.researchcomputing.ca/events Training Inquiries: ...
281 views
3w ago
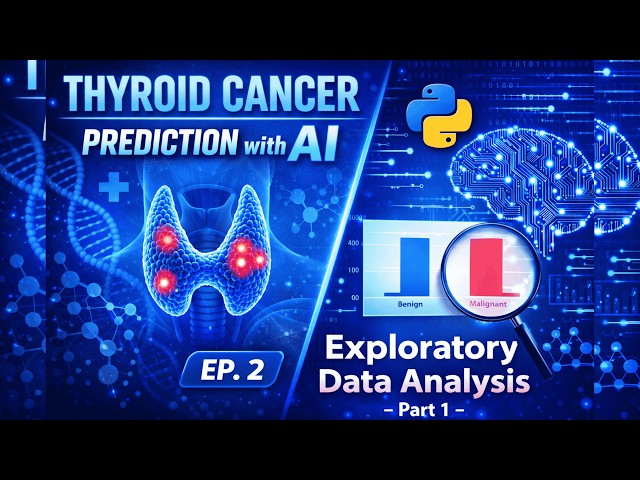
Part 2 of our Thyroid Cancer Recurrence Prediction Series! In this video, we explore categorical features through beautiful, ...
29 views