ViewTube

ViewTube
Sign inSign upSubscriptions
Filters

Upload date

Type

Duration

Sort by

Features

Reset

476 results

adrian m.n.
Graph visualization in the browser with D3.js | Building smollerGraph #4

We give smollerGraph a UI of its own, after its code gets checked on each push by cpplint, against Google's style guide, and by ...

49:22
Graph visualization in the browser with D3.js | Building smollerGraph #4

3 views

1d ago

SoftwarePlaza
How CodeScene uses CodeHealth Metrics to stop AI Agents from degrading code

Markus Borg, Principal Researcher at CodeScene, joins us to discuss why AI coding agents struggle when pointed at complex ...

49:19
How CodeScene uses CodeHealth Metrics to stop AI Agents from degrading code

15 views

2d ago

Neuron UCI
Interactive DataFrame Visualisation with Plotly | ISOM5650 2.5

Create readable Plotly figures from DataFrames. Explain axes, units and trace encodings, then demonstrate legends, 3D rotation ...

21:01
Interactive DataFrame Visualisation with Plotly | ISOM5650 2.5

5 views

5d ago

SumProduct
Creating 3D Maps in Excel from multiple CSV Files - Cristiano Galvao - Excel Virtually Global 2026

In this session, Cristiano Galvao will demonstrate how to import multiple CSV text files into Microsoft Excel at once, combine them ...

44:33
Creating 3D Maps in Excel from multiple CSV Files - Cristiano Galvao - Excel Virtually Global 2026

31 views

1d ago

The Course Library
Matplotlib in Python Explained | Create Beautiful Charts & Graphs #python #coding

Learn how to create beautiful charts and graphs using Matplotlib in Python! In this beginner-friendly tutorial, you'll discover how to ...

23:24
Matplotlib in Python Explained | Create Beautiful Charts & Graphs #python #coding

1 view

5d ago

Learn Data Easy
Claude Code Commands Explained: Are You Using the Right Ones?

Claude Code has more commands than you might realise - but which ones are actually useful? In this video, we explore the ...

20:11
Claude Code Commands Explained: Are You Using the Right Ones?

94 views

2d ago

CodeTimelapse
12 Years of PHP Interpreter Development in Minutes

Watch the complete 12-year history of the php/php-src repository unfold in this captivating Gource visualization. See 149548 ...

20:01
12 Years of PHP Interpreter Development in Minutes

4 views

1d ago

Marco Campolo
Analyze Stock Data in Pandas (Time Series & Visualizations) | Lesson 5

Welcome to Lesson 5 (Module 5) of the complete Python Pandas masterclass! Today, we are diving into Specialized Topics to ...

41:27
Analyze Stock Data in Pandas (Time Series & Visualizations) | Lesson 5

6 views

6d ago

Michael G Wagner and Audio Brewers
First Look: ab Visualiser HOA Pro – Exclusive World Premiere

Summary: Audio Brewers turns six, and Alejandro Cabrera gives us the world-premiere first look at ab Visualiser HOA Pro, ...

32:59
First Look: ab Visualiser HOA Pro – Exclusive World Premiere

810 views

1d ago

Anas Riad
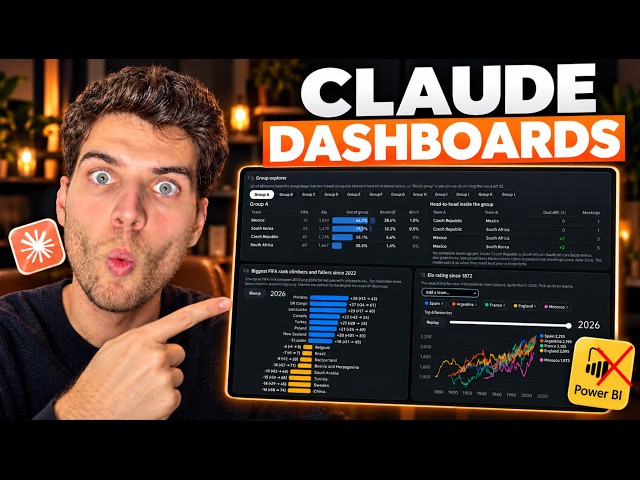
Can Claude Dashboards Actually Replace Power BI? (2 Demos)

Can Claude Dashboards actually replace Power BI? I built 2 full demos with Claude Dashboards and Claude Motion, then ...

21:19
Can Claude Dashboards Actually Replace Power BI? (2 Demos)

1,851 views

7d ago

CODESYS Group
CODESYS Feature Briefing | Fall 2026

What's new in CODESYS? Which new features can you look forward to? What can they actually do for you? What are the ongoing ...

1:42:36
CODESYS Feature Briefing | Fall 2026

708 views

3d ago

Ugandhar Vaddi
Data Visualization in Python | Matplotlib, Seaborn & Pandas Tutorial

Learn how to visualize data in Python using Matplotlib, Seaborn, and Pandas. In this tutorial, we explore different types of charts, ...

1:03:48
Data Visualization in Python | Matplotlib, Seaborn & Pandas Tutorial

11 views

1d ago

Jonas Lindemann
User interfaces with PyQt

User interfaces with PyQt Timestamps: 00:00 - Introduction & Motivation for GUIs in Research 02:35 - Qt Architecture & Python ...

1:33:40
User interfaces with PyQt

80 views

3d ago

Chong-U — AI Oriented Dev
Retro Diffusion Does 3D Now, So I Made a Game With It (Opus 5.5 + GPT 6 Astra)

My AI Game Dev Skills & Workflows ▻ https://www.vibegamedev.com/?utm_campaign=vgd-24-rd3d Play Retro del Sol For ...

23:12
Retro Diffusion Does 3D Now, So I Made a Game With It (Opus 5.5 + GPT 6 Astra)

15,709 views

3d ago

Anfa Code
Matplotlib Library In Python

In this video: In this video, we will learn Matplotlib with simple explanation and practical examples. Welcome to ANFA CODE ...

29:07
Matplotlib Library In Python

81 views

Streamed 1d ago

Neural
Machine Learning L12: EDA & Data Preprocessing Part 1 Visualization, Outliers, IQR & Missing Value 🤖

Welcome to Machine Learning – Lesson 12! | ML Explained in Hindi In this session, we start Exploratory Data Analysis (EDA) ...

47:34
Machine Learning L12: EDA & Data Preprocessing Part 1 Visualization, Outliers, IQR & Missing Value 🤖

395 views

6d ago

Simplilearn
Master Data Science in 2027 | Complete Course in Python, ML & AI for Beginners | Simplilearn

Micrososft Azure - Data Analyst Course ...

23:30:30
Master Data Science in 2027 | Complete Course in Python, ML & AI for Beginners | Simplilearn

7,415 views

1d ago

Intent Solutions
Build an MCP App with Claude Code | From First Prompt to Claude (Full Build)

A working MCP app, built with Claude Code from the first prompt to production, then opened inside Claude. This is the full, uncut ...

1:09:57
Build an MCP App with Claude Code | From First Prompt to Claude (Full Build)

110 views

5d ago

Dr. Joe
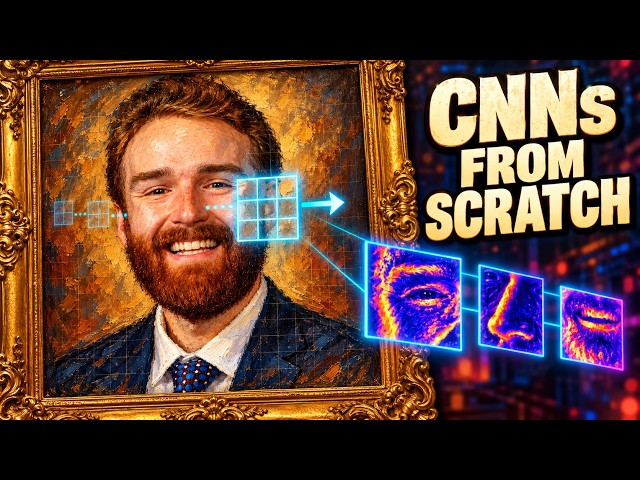
Build a CNN From Scratch in Python | How Computers Learn to See

How does a neural network learn to recognize handwriting? Let's build one and look inside. In this Dr. Joe code-along, we build ...

44:12
Build a CNN From Scratch in Python | How Computers Learn to See

34 views

3d ago

Muhammad Latif
The Only Matplotlib Tutorial You Need for AI Engineer

Learn Matplotlib in Python with this beginner-friendly, hands-on tutorial designed for aspiring AI Engineers! In this tutorial, you'll ...

37:39
The Only Matplotlib Tutorial You Need for AI Engineer

64 views

3d ago