ViewTube

ViewTube
Sign inSign upSubscriptions
Filters

Upload date

Type

Duration

Sort by

Features

Reset

11,682 results

UtahJS
Drawing Data with D3.js and AI

UtahJS Conf 2026, www.utahjs.com D3.js is one of the most powerful visualization libraries in existence - and one of the most ...

29:43
Drawing Data with D3.js and AI

577 views

4w ago

Kitware
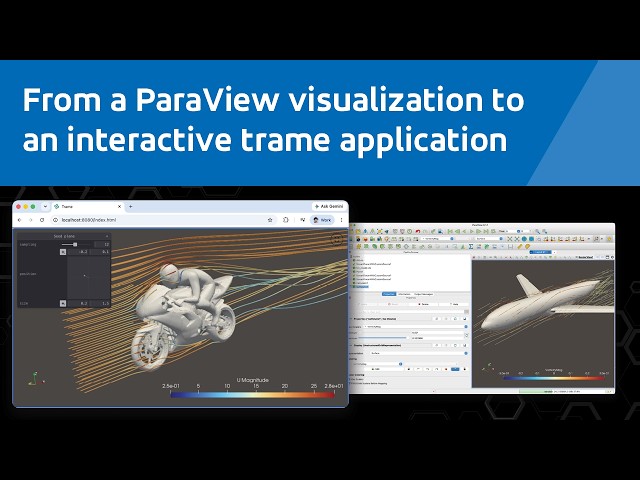
From a ParaView visualization to an interactive trame application

ParaView gives you the power to explore data at any scale. Its general-purpose interface supports a wide range of needs, but ...

1:02:09
From a ParaView visualization to an interactive trame application

232 views

2w ago

Tech With Tim
Building a Real App with Claude Code (Start to Finish)

Get started with ImageKit for free: https://tinyurl.com/595kfr92 I'm a software engineer with 10+ years of experience, and in this ...

22:58
Building a Real App with Claude Code (Start to Finish)

151,332 views

4w ago

Satyam Raha
NeuroScope Tutorial: Visualize Neural Network Training & Machine Learning Models

Website: neuroscope.retrogradearc.com Learn how to use NeuroScope, a web-based visualization tool designed to make the ...

31:27
NeuroScope Tutorial: Visualize Neural Network Training & Machine Learning Models

76 views

3w ago

Tokyo Rock Girl
Building a Music Visualizer with Claude Code | Liv's AI Laboratory: Claude Code Experiment #1

Welcome to Liv's AI Laboratory! This time, the experiment moves from music to code. Today I'm building a music visualizer live ...

4:09:06
Building a Music Visualizer with Claude Code | Liv's AI Laboratory: Claude Code Experiment #1

178 views

Streamed 3w ago

adrian m.n.
Graph visualization in the browser with D3.js | Building smollerGraph #4

We give smollerGraph a UI of its own, after its code gets checked on each push by cpplint, against Google's style guide, and by ...

49:22
Graph visualization in the browser with D3.js | Building smollerGraph #4

5 views

3d ago

JK ULTRA | Jennifer Carmody and SONIC VESSEL
Aphantasia: Can’t Visualize? There’s Another Way In | The Sonic Vessel

Get 10% off with code JKXTHESONICVESSEL2026 @ https://www.thesonicvessel.com What happens when you can't ...

1:23:44
Aphantasia: Can’t Visualize? There’s Another Way In | The Sonic Vessel

5,289 views

2w ago

Code Crafter Academy
Master Stem Plots in Python Matplotlib 📊 | Complete Python Data Visualization Tutorial

Welcome to Code Crafter Academy! Want to visualize numerical data using Python? In this tutorial, we'll explore how to create ...

46:02
Master Stem Plots in Python Matplotlib 📊 | Complete Python Data Visualization Tutorial

10 views

13d ago

Kevin Ripka
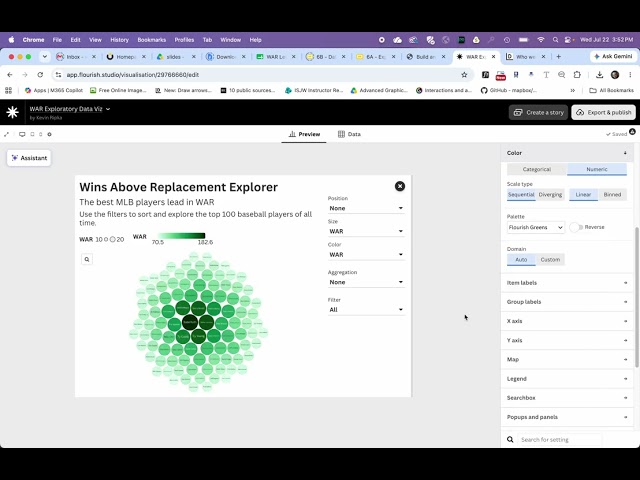
M3B - Exploratory Data Visualization w/ Flourish

0:00 Intro 1:24 Select a Template 4:05 Adding Data 5:18 Defining Data Types 6:23 Headline/Frame 8:44 Sizing by Data 9:58 ...

29:18
M3B - Exploratory Data Visualization w/ Flourish

42 views

1mo ago

Neuron UCI
Interactive DataFrame Visualisation with Plotly | ISOM5650 2.5

Create readable Plotly figures from DataFrames. Explain axes, units and trace encodings, then demonstrate legends, 3D rotation ...

21:01
Interactive DataFrame Visualisation with Plotly | ISOM5650 2.5

7 views

7d ago

Tokyo Rock Girl
Building a Music Visualizer with Claude Code | Liv's AI Laboratory: Claude Code Experiment #2

Welcome to Liv's AI Laboratory! This time, the experiment moves from music to code. Today I'm building a music visualizer live ...

7:53:08
Building a Music Visualizer with Claude Code | Liv's AI Laboratory: Claude Code Experiment #2

269 views

Streamed 3w ago

CodeTimelapse
Rendering TensorFlow's 200,000 Commits: A Code Avalanche

This video visualizes the entire 7-year history of the TensorFlow GitHub repository, showcasing 199428 commits from over 4922 ...

20:01
Rendering TensorFlow's 200,000 Commits: A Code Avalanche

9 views

1mo ago

classeswithme
excel visualization project all
1:03:12
excel visualization project all

0 views

0

Victor Akinode
Data Visualisation with Python for Beginners | Matplotlib Charts | Lesson 15

Learn how to turn a small dataset into clear charts using Python, pandas and Matplotlib in Google Colab. In Lesson 15 of The ...

27:47
Data Visualisation with Python for Beginners | Matplotlib Charts | Lesson 15

128 views

11d ago

WestDRI
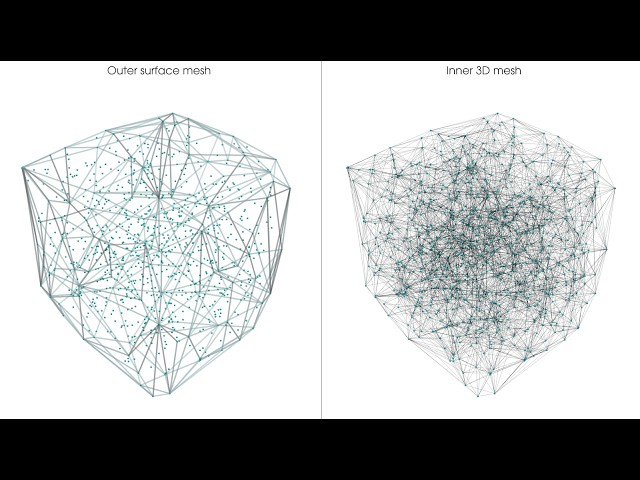
3D data processing and visualization with PyVista

Other SFU Research Computing training events: https://training.researchcomputing.ca/events Training Inquiries: ...

58:15
3D data processing and visualization with PyVista

295 views

3w ago

Alfonso Santamaria
I Explored the ENTIRE Simpsons Dataset (Python EDA)

In this video, I dive into exploratory data analysis (EDA) on a Simpsons dataset using Python — pandas, seaborn, and matplotlib ...

25:43
I Explored the ENTIRE Simpsons Dataset (Python EDA)

27 views

1mo ago

CodeTimelapse
12 Years of PHP Interpreter Development in Minutes

Watch the complete 12-year history of the php/php-src repository unfold in this captivating Gource visualization. See 149548 ...

20:01
12 Years of PHP Interpreter Development in Minutes

6 views

3d ago

Saad Saleem
egui Minimum Number Visualizer 🦀

In this video, we're building a Minimum Number Visualizer using Rust and egui Instead of finding the lowest number in the ...

1:18:35
egui Minimum Number Visualizer 🦀

263 views

1mo ago

Gourcer
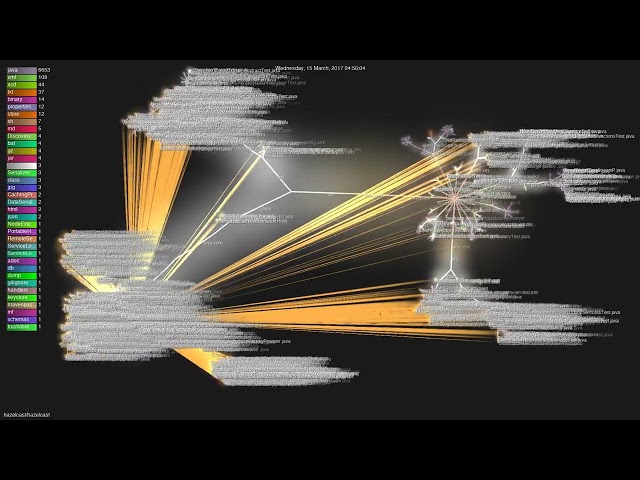
hazelcast/hazelcast - Gource visualisation

Watch the development journey of hazelcast by hazelcast! Hazelcast is a unified real-time data platform combining stream ...

22:07
hazelcast/hazelcast - Gource visualisation

153 views

3w ago

CodeTimelapse
ReactOS: 19 Years, 453 Devs, 89,749 Commits - The OS That Never Stops

Witness ReactOS, a free Windows-compatible OS, grow and transform over 19 years in this Gource visualization. You'll track ...

20:00
ReactOS: 19 Years, 453 Devs, 89,749 Commits - The OS That Never Stops

86 views

2w ago