Upload date
All time
Last hour
Today
This week
This month
This year
Type
All
Video
Channel
Playlist
Movie
Duration
Short (< 4 minutes)
Medium (4-20 minutes)
Long (> 20 minutes)
Sort by
Relevance
Rating
View count
Features
HD
Subtitles/CC
Creative Commons
3D
Live
4K
360°
VR180
HDR
5,196,048 results
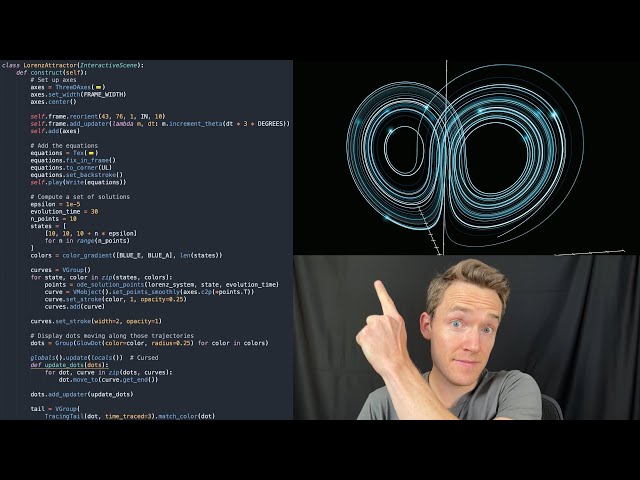
A behind-the-scenes look at how I animate videos. Code for all the videos: https://github.com/3b1b/videos Manim: ...
3,269,226 views
2y ago
This course teaches you how to visualize data in the browser using D3.js. Watch it here or check out the interactive version at ...
343,490 views
8y ago
Ryan Fleury's talk at BSC 2025 on the work he's been doing for the Rad Debugger. Ryan's links: - https://rfleury.com ...
83,558 views
1y ago
Recorded live on 2016-06-16. Creating a visualization tool about NTSC/composite video signal for a possible future video. Twitter: ...
276,363 views
Streamed 10y ago
Welcome to the Complete Data Visualization in Python Course! In this full video tutorial, we're diving deep into the world of ...
302,106 views
Learn how to design great software in 7 steps: https://arjan.codes/designguide. A very common thing you want to do in Python is ...
118,156 views
4y ago
Learn how to use VS Code for beginners with this step-by-step tutorial. Learn how to build a website from a Figma design with ...
372,825 views
10mo ago
Code visualization tools can be a great way to understand the intricacies of large code bases but they can be problematic when ...
417 views
6y ago
This video today is a crash course on Seaborn, a data visualization library for Python built on top of Matplotlib. It makes it super ...
25,316 views
9mo ago
In this webinar, you will learn about some of the tools yWorks uses and provides for creating bespoke graph visualization apps for ...
1,619 views
5y ago
Learn data visualization with D3.js. D3 is a JavaScript library for manipulating documents based on data. D3 helps you bring data ...
370,732 views
Music visualization brings back nostalgia if you were a Winamp user. @CharStiles will teach us how to live-code music ...
2,867 views
Learn data analysis, data visualizations, and image processing techniques using real-world astronomical data. The course offers ...
139,626 views
Take my Full Tableau Course Here: https://www.analystbuilder.com/courses/tableau-for-data-visualization Download Tableau: ...
468,601 views
Video Description: Master Data Visualization with Python: From Beginner to Advanced! In this comprehensive Data ...
47,146 views
Build an intuitive mental model of core data structures and algorithms using relatable, real-world analogies. Topics range from ...
304,244 views
2mo ago
Debugging Your Code with Data Visualization [EuroPython 2018 - Talk - 2018-07-26 - Fintry [PyData]] [Edinburgh, UK] By James ...
920 views
In this coding challenge, I follow up on the Earthquake Data Visualization challenge and create a 3D version in Processing(Java) ...
64,221 views
9y ago
Learn how to create responsive, animated, interactive charts using Svelte and D3.js from @ever-greg Follow along in your ...
16,663 views
Dataviz is easy with R and ggplot. Give me half and hour and I'll show you all the basics and more! If this vid helps you, please ...
71,440 views
3y ago