Upload date
All time
Last hour
Today
This week
This month
This year
Type
All
Video
Channel
Playlist
Movie
Duration
Short (< 4 minutes)
Medium (4-20 minutes)
Long (> 20 minutes)
Sort by
Relevance
Rating
View count
Features
HD
Subtitles/CC
Creative Commons
3D
Live
4K
360°
VR180
HDR
5,196,051 results
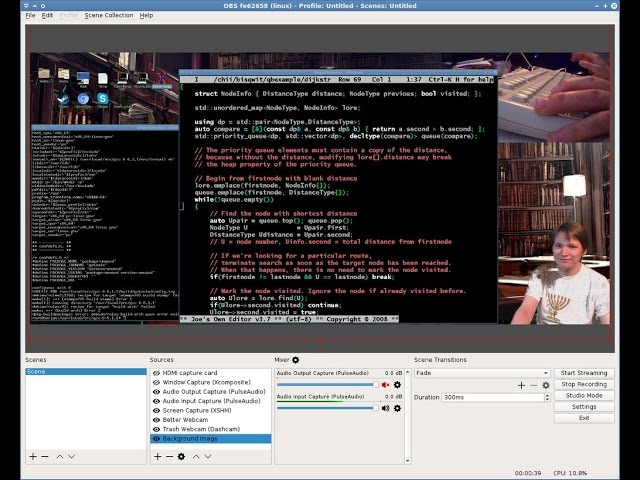
Recorded live on 2016-06-16. Creating a visualization tool about NTSC/composite video signal for a possible future video. Twitter: ...
276,362 views
Streamed 10y ago
Discover the life-changing secrets behind Nikola Tesla's famous 3-6-9 code. In this video, we dive deep into the mysterious power ...
46,259 views
Streamed 1y ago
Summary: Audio Brewers turns six, and Alejandro Cabrera gives us the world-premiere first look at ab Visualiser HOA Pro, ...
596 views
16h ago
There are audio issues with this video that cannot be fixed. We recommend listening to the tutorial without headphones to ...
8,533 views
9y ago
Support me and future courses !!! https://visual-kernel-shop.fourthwall.com https://buymeacoffee.com/visual_kernel Chapters: 0:00 ...
479,282 views
3mo ago
Learn data visualization with D3.js. D3 is a JavaScript library for manipulating documents based on data. D3 helps you bring data ...
370,732 views
4y ago
Ryan Fleury's talk at BSC 2025 on the work he's been doing for the Rad Debugger. Ryan's links: - https://rfleury.com ...
83,558 views
1y ago
Watch the updated version of this course: https://youtu.be/2LhoCfjm8R4 In this data visualization course, you'll learn how to ...
1,164,368 views
7y ago
I AM A BILLIONAIRE - The Quiet Luxury Mindset Shift | Alpha Code Your mind is the first asset you own. Lock into the billionaire ...
96 views
1d ago
Music visualization brings back nostalgia if you were a Winamp user. @CharStiles will teach us how to live-code music ...
2,867 views
Data Analysis with Python: Zero to Pandas” is a practical, beginner-friendly and coding-focused introduction to data analysis ...
200,960 views
Streamed 6y ago
Learn Data Visualization with D3, JavaScript, and React. Part 2: https://youtu.be/H2qPeJx1RDI Created by @currankelleher .
523,336 views
5y ago
http://cppnow.org — Presentation Slides, PDFs, Source Code and other presenter materials are available at: ...
9,709 views
8y ago
Debugging Your Code with Data Visualization [EuroPython 2018 - Talk - 2018-07-26 - Fintry [PyData]] [Edinburgh, UK] By James ...
920 views
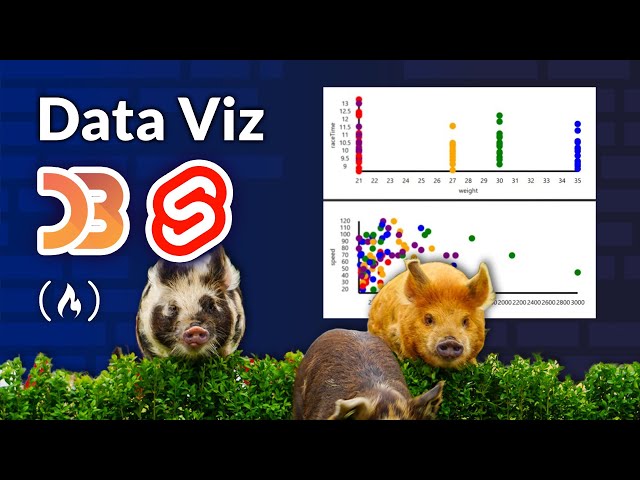
Learn how to create responsive, animated, interactive charts using Svelte and D3.js from @ever-greg Follow along in your ...
16,663 views
... call Dynamic binary visualization and this is a bold statement to make in front of a bunch of really talented reverse Engineers but ...
9,443 views
12y ago
A visual data story told like a movie. Learn data literacy through animated, hand-drawn sketches created carefully in Procreate on ...
613,413 views
9mo ago
What you'll learn! This four-part course introduces core concepts and technical skills to start building custom, interactive data ...
5,711 views
Streamed 3y ago
I AM A BILLIONAIRE - The Silent Empire Mindset Shift | Alpha Code Wealth is built in silence, long before it is seen. Let this mix ...
212 views
2d ago
In today's video, you'll learn how to make a circular spectrogram (irisgram) in P5JS. If you come from another programming ...
16,443 views