Upload date
All time
Last hour
Today
This week
This month
This year
Type
All
Video
Channel
Playlist
Movie
Duration
Short (< 4 minutes)
Medium (4-20 minutes)
Long (> 20 minutes)
Sort by
Relevance
Rating
View count
Features
HD
Subtitles/CC
Creative Commons
3D
Live
4K
360°
VR180
HDR
3,261,300 results
Learn Excel in just 2 hours: https://kevinstratvert.thinkific.com In this step-by-step tutorial, learn how to pull together charts in Excel.
1,513,019 views
3y ago
In this video tutorial for beginners, I will show you how to make charts and graphs in Microsoft Excel. Using data, I will show you ...
419,243 views
4y ago
Download the free course files and follow along here: ➡️ https://www.simonsezit.com/excel-chart-formatting-course-files Learn ...
2,608 views
7mo ago
This comprehensive tutorial will teach you everything you need to know about Excel chart types, chart customization, and creating ...
127,119 views
2y ago
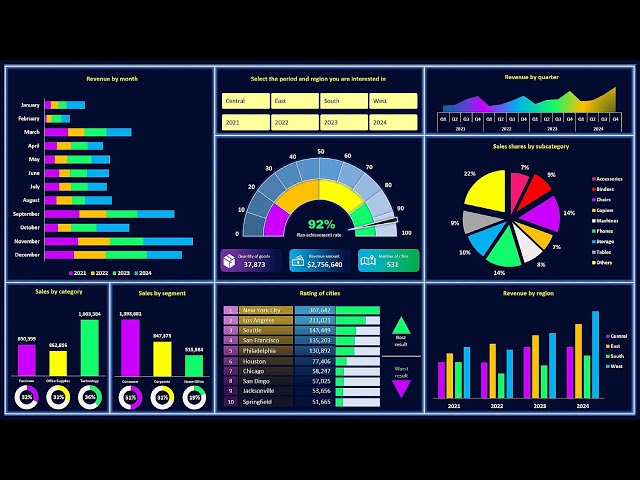
Learn how to create a professional, efficient, and visually appealing dashboard in Excel from scratch! This step-by-step tutorial will ...
304,996 views
1y ago
Excel Data Analysis Full Course Tutorial (7+ Hours) Join Learn Skills Daily for ad-free training, exams, certificates, and exclusive ...
2,267,823 views
FREE Course Files & Projects https://lukeb.co/excel_files Supporter Access: Problems, Certificate, & More ...
3,819,942 views
It covers the following topics: -- Excel Chart Types -- Chart Editing -- Formatting Chart Elements -- Combination Charts -- Handling ...
91,168 views
7y ago
Advance Excel LIVE Course for Professionals - https://web.ptscadexpert.com/new-courses/41 Exciting Announcement: New ...
31,218 views
FREE dataset to follow along: https://other-levels.com/blogs/datasets Get this template + 100+ dashboards: ...
6,467,829 views
This tutorial is for anyone interested in learning how to generate Charts and Graphs in Excel but is primarily focused on the skills ...
25,300 views
Take my Full Excel for Data Analytics Course! https://www.analystbuilder.com/courses/excel-for-data-analytics In this video we ...
1,352,942 views
"️ IBM - Data Analyst ...
26,123 views
Ready to transform your spreadsheets from ordinary to extraordinary? In this tutorial, you'll learn how to take raw, unorganized ...
191,807 views
In this video of this Free Online Excel training, I will show you how to use some tricks to create advanced charts and graphs in ...
200,283 views
Imagine this! You're sitting in front of your computer, looking at a colossal spreadsheet. There are hundreds of rows and ...
89,447 views
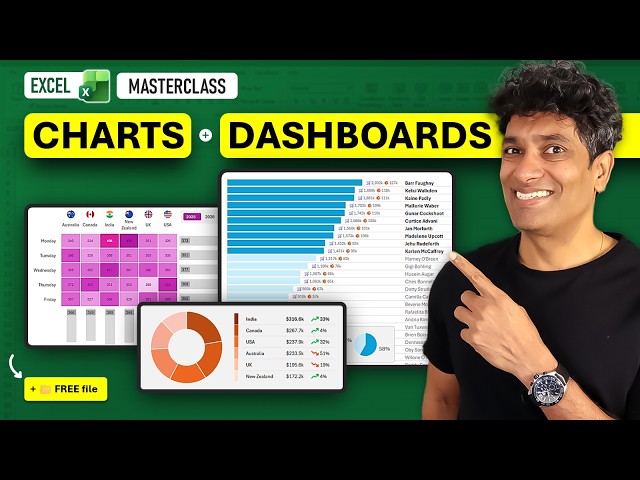
Learn how to create professional, advanced Excel charts in this masterclass by Chandoo. Download Blank data file ...
18,592 views
Streamed 3mo ago
OFF My Dashboards Course (code: SAVE50) https://chandoo.org/wp/excel-school-program/ ~ Become an Excel Dashboard ...
269,560 views
11mo ago
Welcome to our Excel tips and tricks tutorial video containing ten of our best Excel Charts tutorials in one step-by-step Microsoft ...
9,854 views
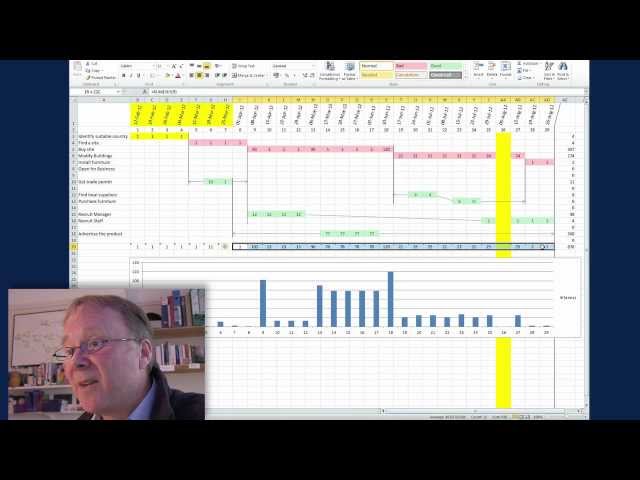
Chris Croft shows you how to make a Gantt Chart using Excel - it's really easy. Starting with your network diagram you build up an ...
243,223 views
14y ago